
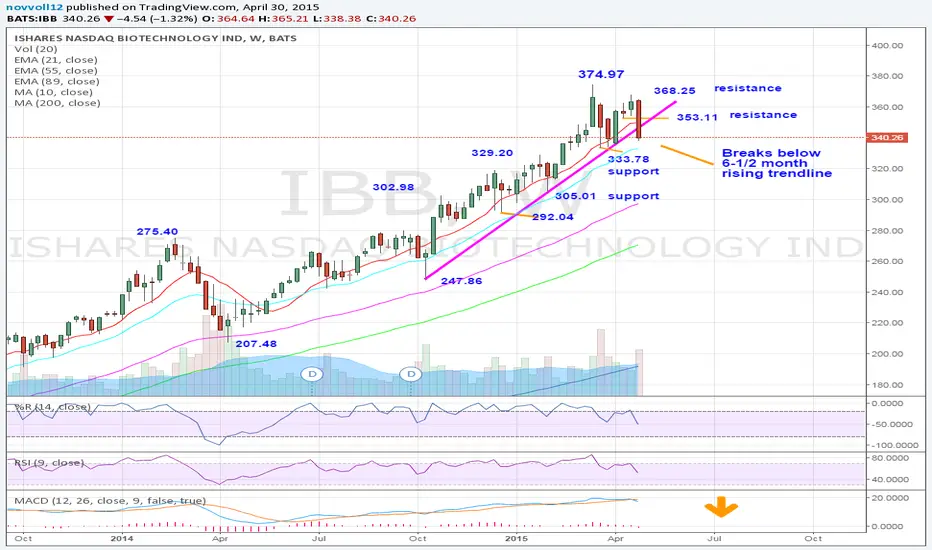
IBB corrected lower from the YTD high at 374.97 (March 20, 2015) to break blow 6-1/2 month rising trendline (as shown on the weekly chart), signaling prolonged consolidation near term. Bears look to test the range support at 333.78 (March 26, 2015 low). A breakdown is needed confirm a double top at 374.97/368.25 and weaken further towards the 305.01/302.98 long term support area. However, if the 333.78 area holds dips, that would reinforce the level as support. Back above 353.11 would suggest scope for further gains towards the 368.25 swing high (April 23, 2015).
Outlook:
Short term: bearish
Long term: bullish
Outlook:
Short term: bearish
Long term: bullish

関連の投稿
免責事項
これらの情報および投稿は、TradingViewが提供または承認する金融、投資、取引、またはその他の種類の助言もしくは推奨であることを意図したものではなく、またこれらに該当するものでもありません。詳細は利用規約をご覧ください。
免責事項
これらの情報および投稿は、TradingViewが提供または承認する金融、投資、取引、またはその他の種類の助言もしくは推奨であることを意図したものではなく、またこれらに該当するものでもありません。詳細は利用規約をご覧ください。