
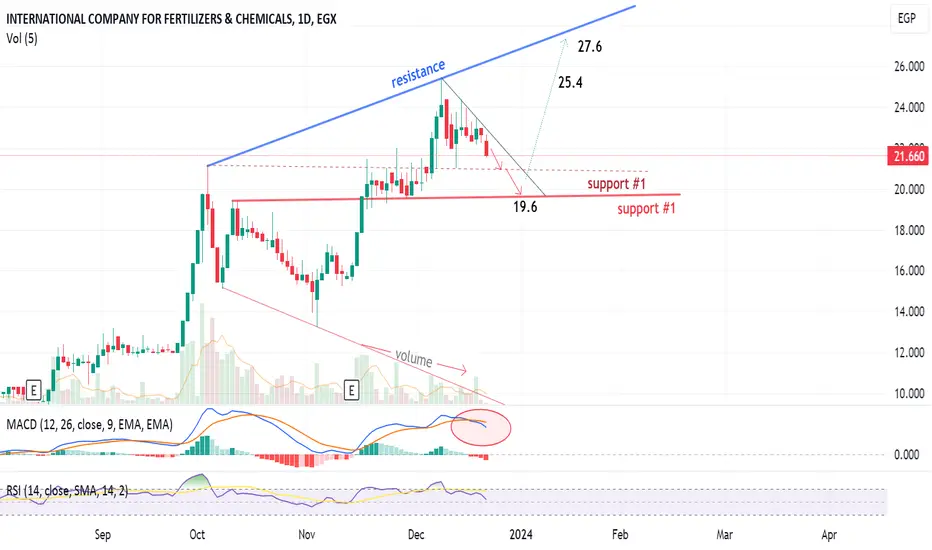
Daily chart, ICFC stock is seen to test support #1 or #2 then rebound towards resistance line (BLUE)
The MACD indicator crossed the signal line downwards = negative sign
Below 19.6, the stop loss should be considered.
The MACD indicator crossed the signal line downwards = negative sign
Below 19.6, the stop loss should be considered.

免責事項
これらの情報および投稿は、TradingViewが提供または承認する金融、投資、取引、またはその他の種類の助言もしくは推奨であることを意図したものではなく、またこれらに該当するものでもありません。詳細は利用規約をご覧ください。
免責事項
これらの情報および投稿は、TradingViewが提供または承認する金融、投資、取引、またはその他の種類の助言もしくは推奨であることを意図したものではなく、またこれらに該当するものでもありません。詳細は利用規約をご覧ください。