
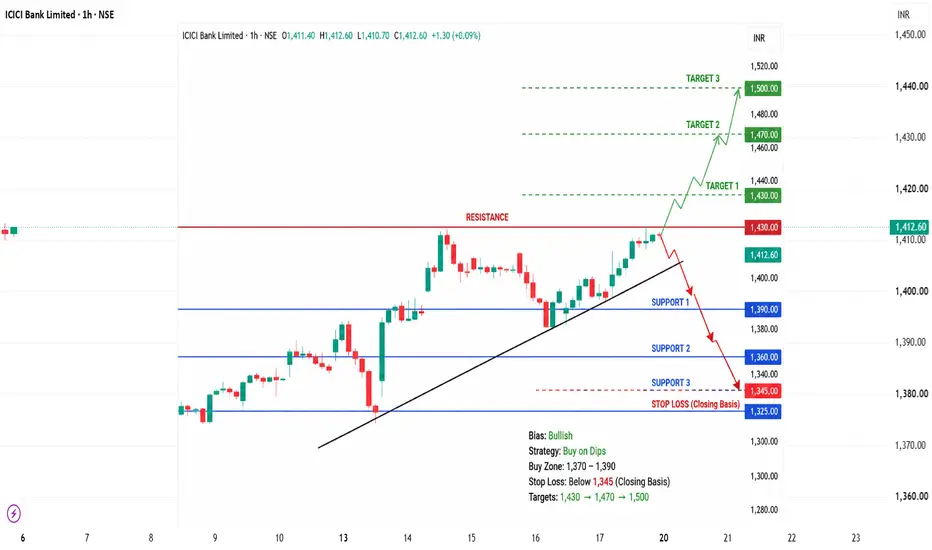
ICICI Bank is trading above its key moving averages and continues to show positive momentum. Recent technical indicators (RSI, MACD, ADX) remain constructive, suggesting the primary trend is still up.
📈 Key Resistance Levels
₹1,420–1,430 – Immediate resistance zone
₹1,450–1,470 – Strong supply zone
₹1,495–1,500 – Major resistance / 52-week high area
📉 Key Support Levels
₹1,390–1,380 – First support
₹1,360–1,345 – Strong demand zone
₹1,320–1,325 – Major swing support
Trading Scenarios
🟢 Bullish
Holding above ₹1,380–1,390 keeps the uptrend intact.
A decisive breakout above ₹1,430 can open the way toward ₹1,470–1,500.
🔴 Bearish
A close below ₹1,360 could trigger profit booking.
Below ₹1,325, the trend would weaken and a deeper correction becomes possible.
Swing Trading Plan
Buy Zone: ₹1,370–1,390
Stop Loss: Below ₹1,345 (closing basis)
Targets: ₹1,430 → ₹1,470 → ₹1,500
Overall View: ICICI Bank remains one of the stronger banking stocks. As long as it stays above the ₹1,360 support zone, the trend favors buying on dips rather than selling rallies.
📈 Key Resistance Levels
₹1,420–1,430 – Immediate resistance zone
₹1,450–1,470 – Strong supply zone
₹1,495–1,500 – Major resistance / 52-week high area
📉 Key Support Levels
₹1,390–1,380 – First support
₹1,360–1,345 – Strong demand zone
₹1,320–1,325 – Major swing support
Trading Scenarios
🟢 Bullish
Holding above ₹1,380–1,390 keeps the uptrend intact.
A decisive breakout above ₹1,430 can open the way toward ₹1,470–1,500.
🔴 Bearish
A close below ₹1,360 could trigger profit booking.
Below ₹1,325, the trend would weaken and a deeper correction becomes possible.
Swing Trading Plan
Buy Zone: ₹1,370–1,390
Stop Loss: Below ₹1,345 (closing basis)
Targets: ₹1,430 → ₹1,470 → ₹1,500
Overall View: ICICI Bank remains one of the stronger banking stocks. As long as it stays above the ₹1,360 support zone, the trend favors buying on dips rather than selling rallies.

関連の投稿
免責事項
これらの情報および投稿は、TradingViewが提供または承認する金融、投資、取引、またはその他の種類の助言もしくは推奨であることを意図したものではなく、またこれらに該当するものでもありません。詳細は利用規約をご覧ください。
関連の投稿
免責事項
これらの情報および投稿は、TradingViewが提供または承認する金融、投資、取引、またはその他の種類の助言もしくは推奨であることを意図したものではなく、またこれらに該当するものでもありません。詳細は利用規約をご覧ください。