
Hello Crypto Lovers,
Mars Signals team wishes you high profits.
This is a one-day-time frame analysis for ICPUSDT
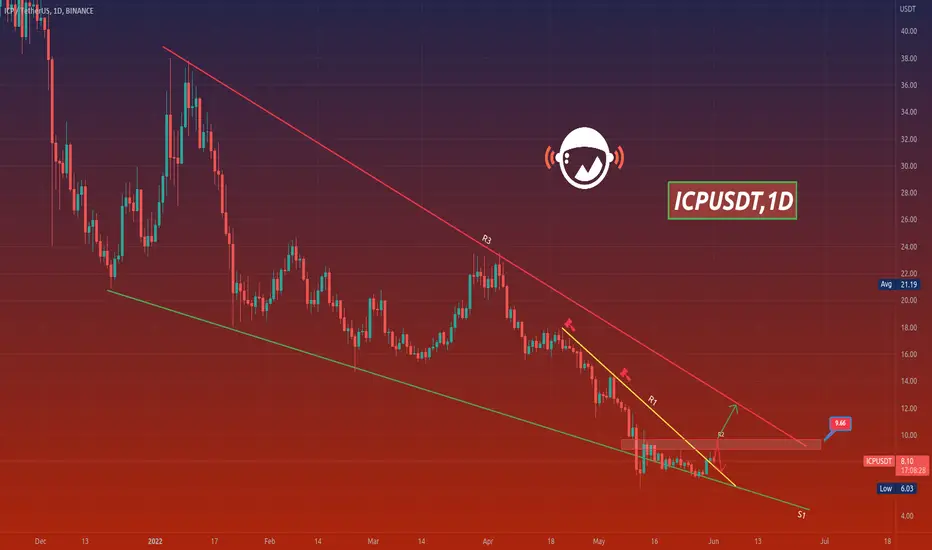
The price is moving in a descending channel and R3 line shows a long-term resistance line and the rejection of price is clear by it. Also S1 line resembles a long-term support line and the well support of the price is obvious on it at several points. The yellow line is our 4-hour resistance line and the price could not break it upward. At the moment, the price is fluctuating below R2 area and over the yellow line. Both the density and weakness of price is seen here and we expect the price to move toward R2 and if it fixes over it, then it will move toward R3 and will have more increase. Even it is possible for the price to lose the support and face more fall.
Warning: This is just a suggestion and we do not guarantee profits. We advise you to analyze the chart before opening any positions.
Wish you luck
Mars Signals team wishes you high profits.
This is a one-day-time frame analysis for ICPUSDT
The price is moving in a descending channel and R3 line shows a long-term resistance line and the rejection of price is clear by it. Also S1 line resembles a long-term support line and the well support of the price is obvious on it at several points. The yellow line is our 4-hour resistance line and the price could not break it upward. At the moment, the price is fluctuating below R2 area and over the yellow line. Both the density and weakness of price is seen here and we expect the price to move toward R2 and if it fixes over it, then it will move toward R3 and will have more increase. Even it is possible for the price to lose the support and face more fall.
Warning: This is just a suggestion and we do not guarantee profits. We advise you to analyze the chart before opening any positions.
Wish you luck

免責事項
これらの情報および投稿は、TradingViewが提供または承認する金融、投資、取引、またはその他の種類の助言もしくは推奨であることを意図したものではなく、またこれらに該当するものでもありません。詳細は利用規約をご覧ください。
免責事項
これらの情報および投稿は、TradingViewが提供または承認する金融、投資、取引、またはその他の種類の助言もしくは推奨であることを意図したものではなく、またこれらに該当するものでもありません。詳細は利用規約をご覧ください。