ロング
ICX bottom 80% confirmed: wyckoff accumulation in volume zone
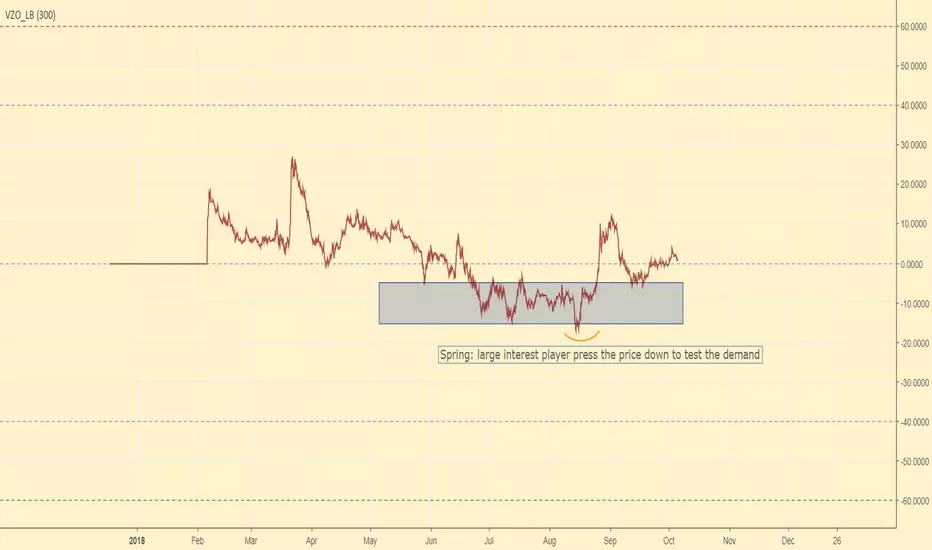
Bottom is forming. Or at least really near, my call last time for ICX was longterm accumulating sub 1000sts still intact, here are some strong signs of bottom accumulation (yet still only 80%, the other 20% is BTC price which wont show in ICX chart ofcourse)
- Volume zone accumulation with clear spring test back in August. (See volume zone chart)
- RSI also break out 1 year down trend in August. (You could see RSI chart)
These indicators are showing you the truth of what happening in the past 10 month bear market, they dont tell you possible entry price, but they tell you time to accumulate for longterm play. It was evidently in detecting supply/demand imbalance.
Note: My call are longterm call so be prepared for any flash crash test to 500 or even 300. Small position will help you navigate the psychology volatility when investing in altcoins
Longterm target: 5000 - 8000sts
- Volume zone accumulation with clear spring test back in August. (See volume zone chart)
- RSI also break out 1 year down trend in August. (You could see RSI chart)
These indicators are showing you the truth of what happening in the past 10 month bear market, they dont tell you possible entry price, but they tell you time to accumulate for longterm play. It was evidently in detecting supply/demand imbalance.
Note: My call are longterm call so be prepared for any flash crash test to 500 or even 300. Small position will help you navigate the psychology volatility when investing in altcoins
Longterm target: 5000 - 8000sts

免責事項
これらの情報および投稿は、TradingViewが提供または承認する金融、投資、取引、またはその他の種類の助言もしくは推奨であることを意図したものではなく、またこれらに該当するものでもありません。詳細は利用規約をご覧ください。
免責事項
これらの情報および投稿は、TradingViewが提供または承認する金融、投資、取引、またはその他の種類の助言もしくは推奨であることを意図したものではなく、またこれらに該当するものでもありません。詳細は利用規約をご覧ください。