
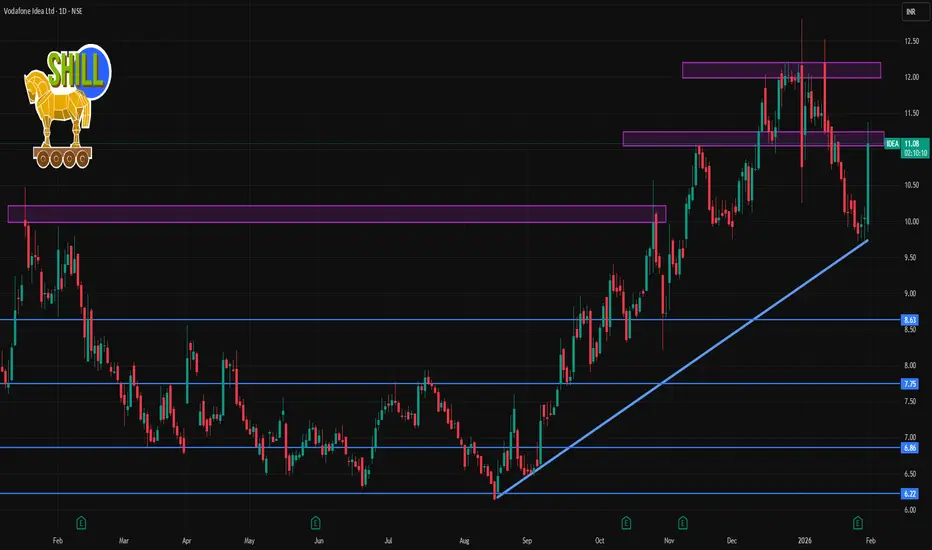
📈 Current Snapshot (Daily)
📍 Approx Price Range Today: ₹10.00 – ₹11.00 per share (indicating recent heavy trading and a bounce)
📍 RSI (Daily): ~38.5 – showing slightly weak momentum but not deeply oversold yet
📍 50 / 100 / 200 DMA: ~₹10.58 / ₹9.94 / ₹9.34 – price around these averages suggests mixed consolidation near crucial pivot zones
🔑 1-Day Key Levels (Pivots)
✔ Pivot Point
Pivot: ~ ₹9.98 → Daily balance point (trend bias flips above / below)
🟢 Support Levels
S1: ~ ₹9.75 → 1st immediate support
S2: ~ ₹9.46 → secondary support zone
S3: ~ ₹9.23 → lower daily support
👉 Below ₹9.23 — increased bearish risk on intraday breakdown.
🔴 Resistance Levels
R1: ~ ₹10.27 → first resistance
R2: ~ ₹10.50 → near daily average resistance
R3: ~ ₹10.79 – ₹11.00 → stronger daily resistance & psychological level
👉 Sustained move above ~₹10.50-₹10.80 can shift short-term bias toward recovery.
📌 Important Context (Market News)
Today’s market action showed a strong positive catalyst: Vodafone Idea shares surged ~13% to ~₹11.36 on Jan 30 2026 after management revealed a large turnaround plan including ₹45,000 cr capex strategy and AGR relief news — indicating significant bullish sentiment shift.
Recent fundamentals: Q3 loss narrowed and ARPU increased, which supports sentiment.
These news catalysts can influence price reaction at key technical levels, so combine them with the pivot levels above for better context.

Contact Knowledgehub for a detailed consultation: Dm on WhatsApp: [wa.link/a2o0kz]-
Phone No: [+91 93102 26243]-
Email: [tradingviewknowledgehub@gmail.com]---
-- Let’s achieve success together!
Phone No: [+91 93102 26243]-
Email: [tradingviewknowledgehub@gmail.com]---
-- Let’s achieve success together!
関連の投稿
免責事項
これらの情報および投稿は、TradingViewが提供または承認する金融、投資、取引、またはその他の種類の助言もしくは推奨であることを意図したものではなく、またこれらに該当するものでもありません。詳細は利用規約をご覧ください。