IDEX Classic Falling Wedge Pattern
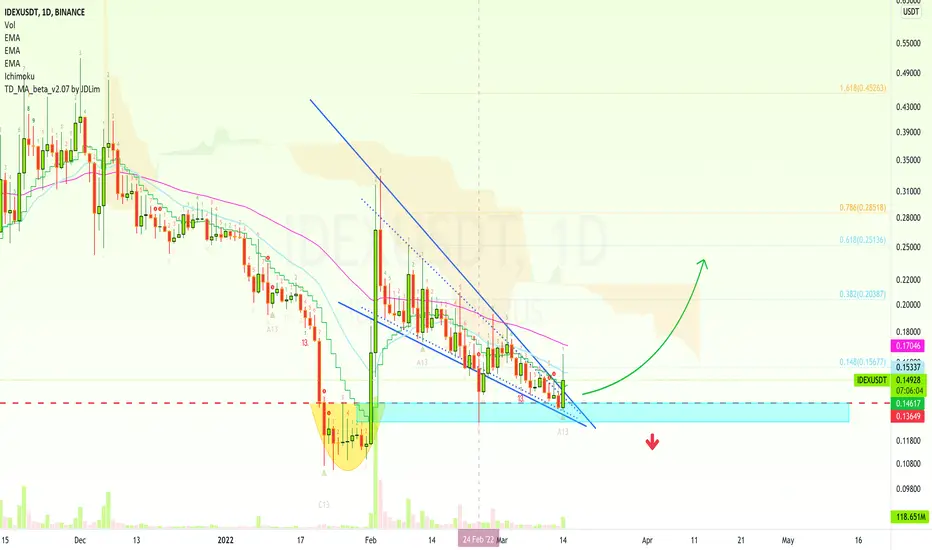
We have the classic falling wedge pattern on the IDEXUSDT chart.
We can see volume going up as an attempt is happening to break out of this pattern.
An "attempt" because we consider this confirmed only after the daily candle closes.
Previous support is being tested and holds based on the challenge of EMA21 and a higher low compared to February 24.
It can grow... If not, we have a chart setup with LOW risk and HIGH potential reward.
Trade at your own risk.
Namaste.

💯 Trading signals (results)
— Late 2026👇
t.me/masteranandatrades/9279
🔥 10-25X Leverage
—Trade-numbers:
t.me/masteranandatrades/9271
✅ PREMIUM &Content
—One-Time Payment
t.me/lamatrades/4 (🔝 since 2017)
— Late 2026👇
t.me/masteranandatrades/9279
🔥 10-25X Leverage
—Trade-numbers:
t.me/masteranandatrades/9271
✅ PREMIUM &Content
—One-Time Payment
t.me/lamatrades/4 (🔝 since 2017)
関連の投稿
免責事項
これらの情報および投稿は、TradingViewが提供または承認する金融、投資、取引、またはその他の種類の助言もしくは推奨であることを意図したものではなく、またこれらに該当するものでもありません。詳細は利用規約をご覧ください。