
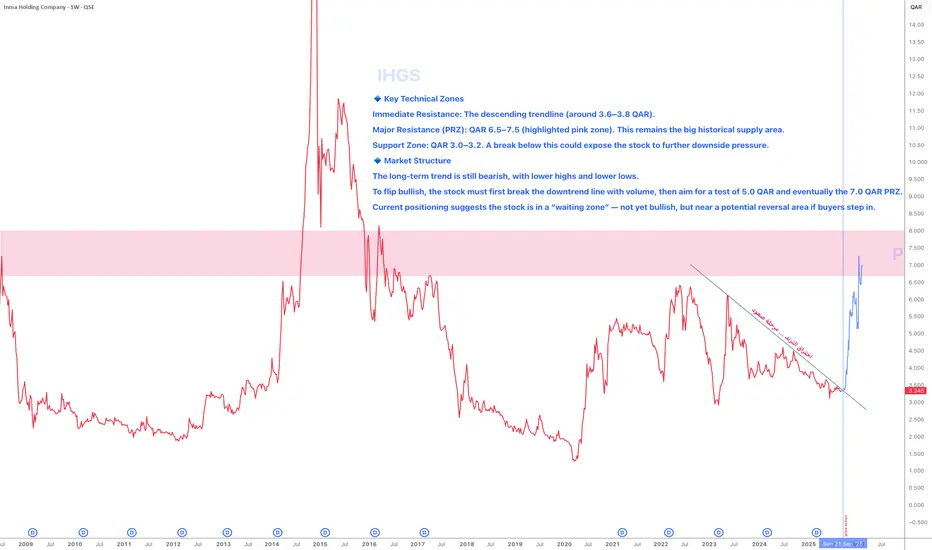
🔹 Key Technical Zones
Immediate Resistance: The descending trendline (around 3.6–3.8 QAR).
Major Resistance (PRZ): QAR 6.5–7.5 (highlighted pink zone). This remains the big historical supply area.
Support Zone: QAR 3.0–3.2. A break below this could expose the stock to further downside pressure.
🔹 Market Structure
The long-term trend is still bearish, with lower highs and lower lows.
To flip bullish, the stock must first break the downtrend line with volume, then aim for a test of 5.0 QAR and eventually the 7.0 QAR PRZ.
Current positioning suggests the stock is in a “waiting zone” — not yet bullish, but near a potential reversal area if buyers step in.
Immediate Resistance: The descending trendline (around 3.6–3.8 QAR).
Major Resistance (PRZ): QAR 6.5–7.5 (highlighted pink zone). This remains the big historical supply area.
Support Zone: QAR 3.0–3.2. A break below this could expose the stock to further downside pressure.
🔹 Market Structure
The long-term trend is still bearish, with lower highs and lower lows.
To flip bullish, the stock must first break the downtrend line with volume, then aim for a test of 5.0 QAR and eventually the 7.0 QAR PRZ.
Current positioning suggests the stock is in a “waiting zone” — not yet bullish, but near a potential reversal area if buyers step in.

免責事項
これらの情報および投稿は、TradingViewが提供または承認する金融、投資、取引、またはその他の種類の助言もしくは推奨であることを意図したものではなく、またこれらに該当するものでもありません。詳細は利用規約をご覧ください。
免責事項
これらの情報および投稿は、TradingViewが提供または承認する金融、投資、取引、またはその他の種類の助言もしくは推奨であることを意図したものではなく、またこれらに該当するものでもありません。詳細は利用規約をご覧ください。