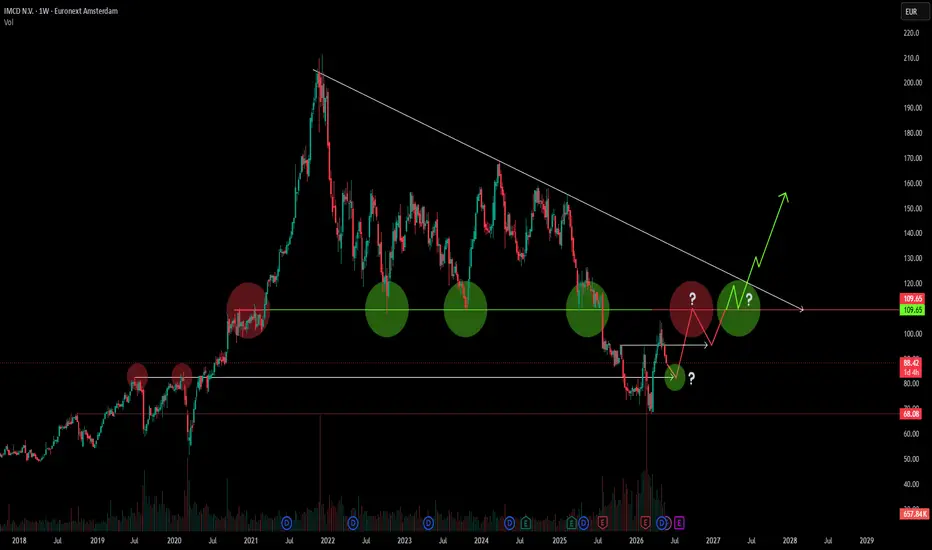
 IMCD has retested its previous all-time high from 8 October 2018 around €68.14, a level that has clearly acted as strong support on March 23rd. From this zone, the stock staged a sharp 21% rebound, confirming buyer interest at that area.
Following this bounce, price action formed a higher high, suggesting that the broader structure has not yet broken down. However, the current movement now appears to be searching for a potential higher low. If that materialises, the most likely support area would be the prior 2019–2020 all-time high zone, which may serve as the next key structural reference.
Overall, the price action remains technically clean and well-defined: a clear retest of historical support, a strong reaction upward, and now a developing pullback within a still-constructive broader trend structure.
The analysis is intentionally clean and straightforward, much like IMCD’s price action itself—so I kept it equally clean, lean, and free of unnecessary noise… unlike my coffee consumption during market hours ;) !
SHORT VERSION:
1. Price structure remains intact with a higher high in place, while the current pullback looks like a search for a higher low.
2. Key area to watch: prior 2019–2020 ATH zone as potential support if weakness continues.
3. Clean structure: major support hold → sharp reaction → constructive pullback within broader uptrend.
No financial advice. Trade safe <3

免責事項
これらの情報および投稿は、TradingViewが提供または承認する金融、投資、取引、またはその他の種類の助言もしくは推奨であることを意図したものではなく、またこれらに該当するものでもありません。詳細は利用規約をご覧ください。
免責事項
これらの情報および投稿は、TradingViewが提供または承認する金融、投資、取引、またはその他の種類の助言もしくは推奨であることを意図したものではなく、またこれらに該当するものでもありません。詳細は利用規約をご覧ください。