
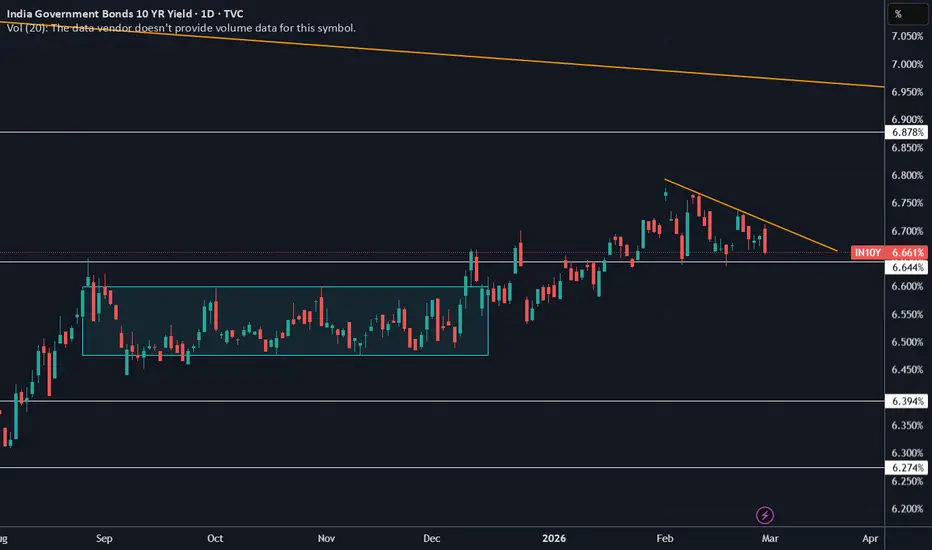
IGB 10Y has formed a descending triangle on daily charts, with 6.64% acting as a support level. A breakout from the pattern indicates a drop in the yields to 6.50%.
Hence for the coming month are expected to trade in the range of 6.50%-6.78%. 6.65% has been acting as a crucial support since last few weeks and it expected to remain the same. If it breaches, this level, it likely to find support at 6.60%, which acted as resistance in the earlier range bound motion. On the upside, if it breaches 6.75% level,it may find resistance at 6.88% levels.
Hence for the coming month are expected to trade in the range of 6.50%-6.78%. 6.65% has been acting as a crucial support since last few weeks and it expected to remain the same. If it breaches, this level, it likely to find support at 6.60%, which acted as resistance in the earlier range bound motion. On the upside, if it breaches 6.75% level,it may find resistance at 6.88% levels.

免責事項
これらの情報および投稿は、TradingViewが提供または承認する金融、投資、取引、またはその他の種類の助言もしくは推奨であることを意図したものではなく、またこれらに該当するものでもありません。詳細は利用規約をご覧ください。
免責事項
これらの情報および投稿は、TradingViewが提供または承認する金融、投資、取引、またはその他の種類の助言もしくは推奨であることを意図したものではなく、またこれらに該当するものでもありません。詳細は利用規約をご覧ください。