
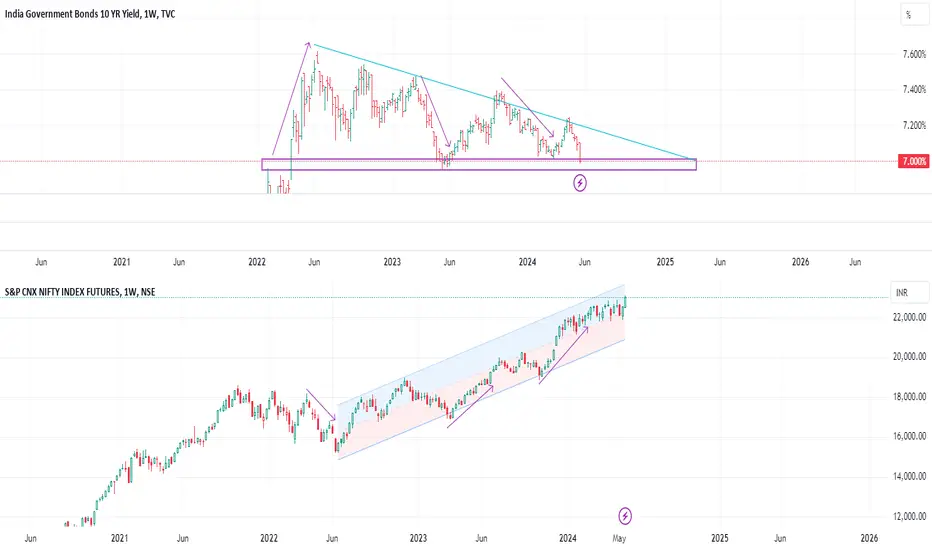
We can see an interesting correlation between t  NIFTY1! he and the $TVC:IN10Y.
See the charts. The top chart is showing India Govt 10 Yr Bond Yield (IN10Y) and the below chart is current Nifty Future.
The purpose of the study is to understand the recent Reserve Bank of India (RBI) highest ever dividend to Indian Govt. As we can see the IN10Y is negotiating it's long term support of around 7.00/6.95 level. (695-700 basic points, bp). And we can see the Nifty is at ATH (23K).
Due to the high dividend of RBI naturally the Govt needs less money to be borrowed from money market through CGs and t-bills. Hence it will push the demand for the existing bonds higher, thus resulting a lower bond yield. If it breaks the 6.95 level in Weekly chart, it will see more downfall, resulting more upside to the Nifty.
Enjoy the show.
NIFTY1! he and the $TVC:IN10Y.See the charts. The top chart is showing India Govt 10 Yr Bond Yield (IN10Y) and the below chart is current Nifty Future.
- The IN10Y is making lower highs while our Nifty is making higher highs.
- In the chart with purple color mentioned the direction. We can see whenever the IN10Y is gong up, Nifty is going down and vice versa.
The purpose of the study is to understand the recent Reserve Bank of India (RBI) highest ever dividend to Indian Govt. As we can see the IN10Y is negotiating it's long term support of around 7.00/6.95 level. (695-700 basic points, bp). And we can see the Nifty is at ATH (23K).
Due to the high dividend of RBI naturally the Govt needs less money to be borrowed from money market through CGs and t-bills. Hence it will push the demand for the existing bonds higher, thus resulting a lower bond yield. If it breaks the 6.95 level in Weekly chart, it will see more downfall, resulting more upside to the Nifty.
Enjoy the show.

免責事項
これらの情報および投稿は、TradingViewが提供または承認する金融、投資、取引、またはその他の種類の助言もしくは推奨であることを意図したものではなく、またこれらに該当するものでもありません。詳細は利用規約をご覧ください。
免責事項
これらの情報および投稿は、TradingViewが提供または承認する金融、投資、取引、またはその他の種類の助言もしくは推奨であることを意図したものではなく、またこれらに該当するものでもありません。詳細は利用規約をご覧ください。