
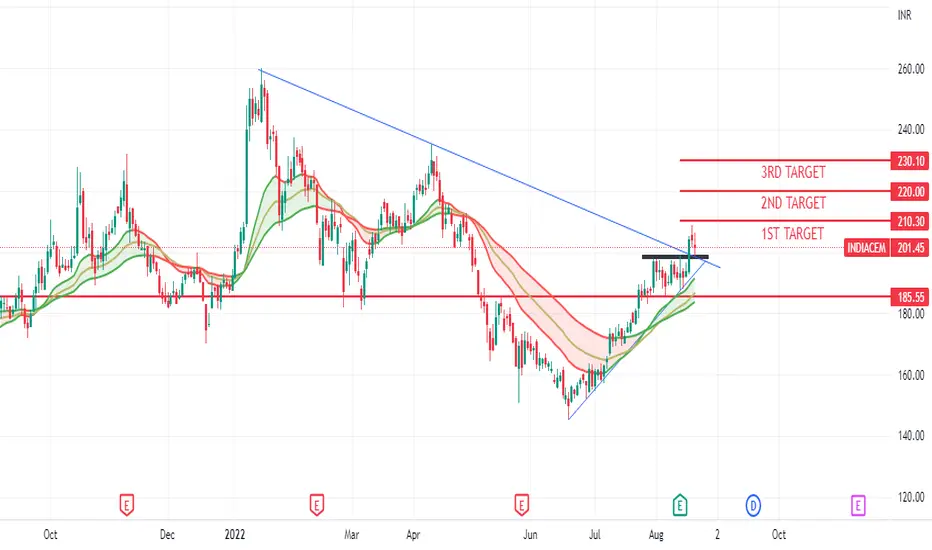
India cement making good price action pattern in daily time frame,
this stock follow more than 200 days trandline resistance and break this trandline with strong bullish candel in daily TF with good volume.
also stock is follow support trandline with good respct.and aslo its PEMA(21,34,55) its turn to flat to sloping upside its best singh for long this stock
my lavels are enter to this stock
BUY = 204-205
TATGET = 210,220,230
STOP LOSS = 195
this stock follow more than 200 days trandline resistance and break this trandline with strong bullish candel in daily TF with good volume.
also stock is follow support trandline with good respct.and aslo its PEMA(21,34,55) its turn to flat to sloping upside its best singh for long this stock
my lavels are enter to this stock
BUY = 204-205
TATGET = 210,220,230
STOP LOSS = 195

免責事項
これらの情報および投稿は、TradingViewが提供または承認する金融、投資、取引、またはその他の種類の助言もしくは推奨であることを意図したものではなく、またこれらに該当するものでもありません。詳細は利用規約をご覧ください。
免責事項
これらの情報および投稿は、TradingViewが提供または承認する金融、投資、取引、またはその他の種類の助言もしくは推奨であることを意図したものではなく、またこれらに該当するものでもありません。詳細は利用規約をご覧ください。