
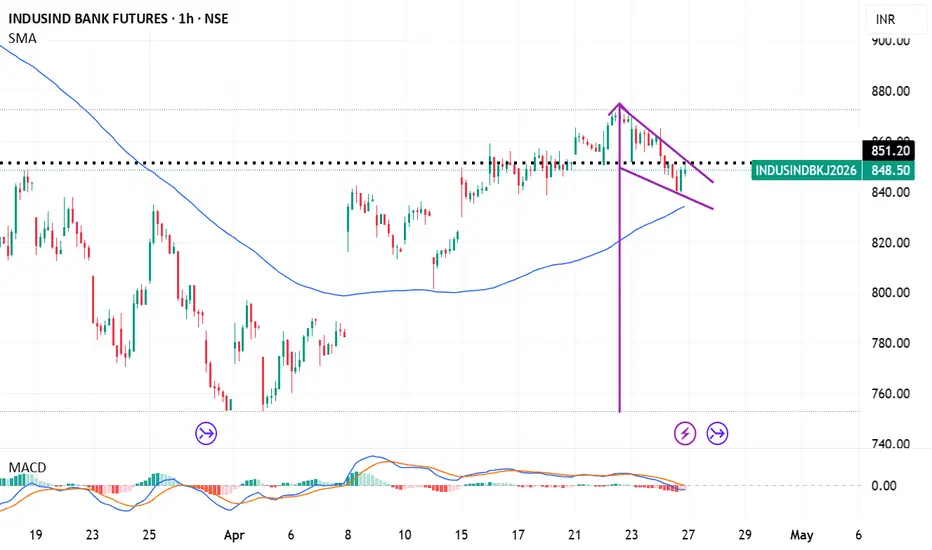
Based on technical analysis of the hourly chart, here is the breakdown of the potential pole and flag setup for IndusInd Bank (INDUSINDBK) around April 24, 2026.
Pattern: Bullish Pole and Flag (Continuation Pattern)
Entry Strategy: Wait for a clear breakout above the flag resistance (around ₹865-870) on high volume on the hourly chart.
Stop Loss (SL): ₹825 (Tight SL) or below ₹820 (Ideal).
Target (T1): ₹900 (Immediate Resistance).
Target (T2): ₹920+ (Target based on flagpole height projection)
トレード終了: 利益確定目標に到達

免責事項
これらの情報および投稿は、TradingViewが提供または承認する金融、投資、取引、またはその他の種類の助言もしくは推奨であることを意図したものではなく、またこれらに該当するものでもありません。詳細は利用規約をご覧ください。
免責事項
これらの情報および投稿は、TradingViewが提供または承認する金融、投資、取引、またはその他の種類の助言もしくは推奨であることを意図したものではなく、またこれらに該当するものでもありません。詳細は利用規約をご覧ください。