
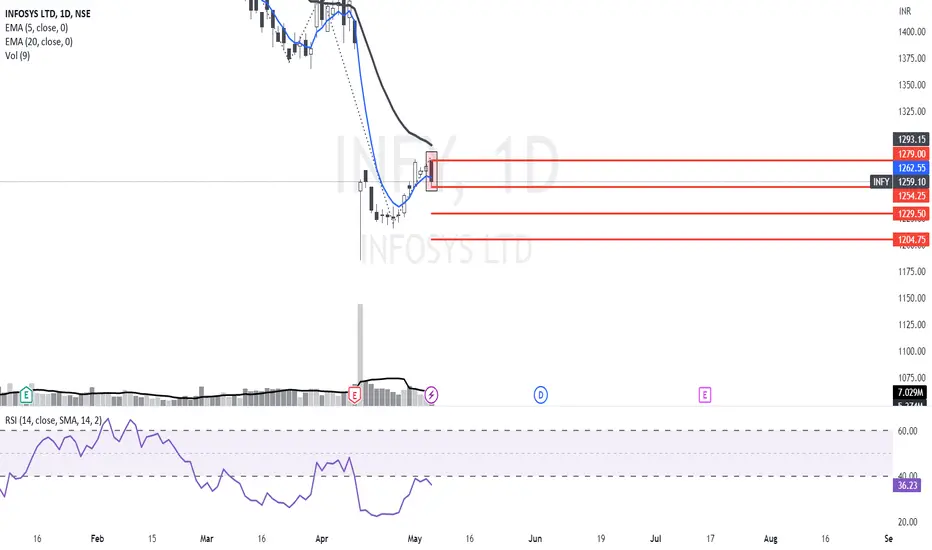
INFY has been in a bearish structure on the daily chart since March 23. It had gapped down to 1190 levels in April after a bad surprise in results. It has pulled back to the 1280 area which is the base of the gap. If selling pressure continues, a short position could be considered keeping the following levels in mind:
SHORT BELOW: 1254.25
STOP LOSS: 1279
TARGET 1: 1229.50
TARGET 2: 1204.75
Please do wait for at least a 15 min candle close below the "SHORT BELOW" level before initiating the trade.
_______________________________________________________________________________________________________________________________
SHORT BELOW: 1254.25
STOP LOSS: 1279
TARGET 1: 1229.50
TARGET 2: 1204.75
Please do wait for at least a 15 min candle close below the "SHORT BELOW" level before initiating the trade.
_______________________________________________________________________________________________________________________________
トレード終了: ストップロスに到達
Stop loss hit, trade closed.
免責事項
これらの情報および投稿は、TradingViewが提供または承認する金融、投資、取引、またはその他の種類の助言もしくは推奨であることを意図したものではなく、またこれらに該当するものでもありません。詳細は利用規約をご覧ください。
免責事項
これらの情報および投稿は、TradingViewが提供または承認する金融、投資、取引、またはその他の種類の助言もしくは推奨であることを意図したものではなく、またこれらに該当するものでもありません。詳細は利用規約をご覧ください。