
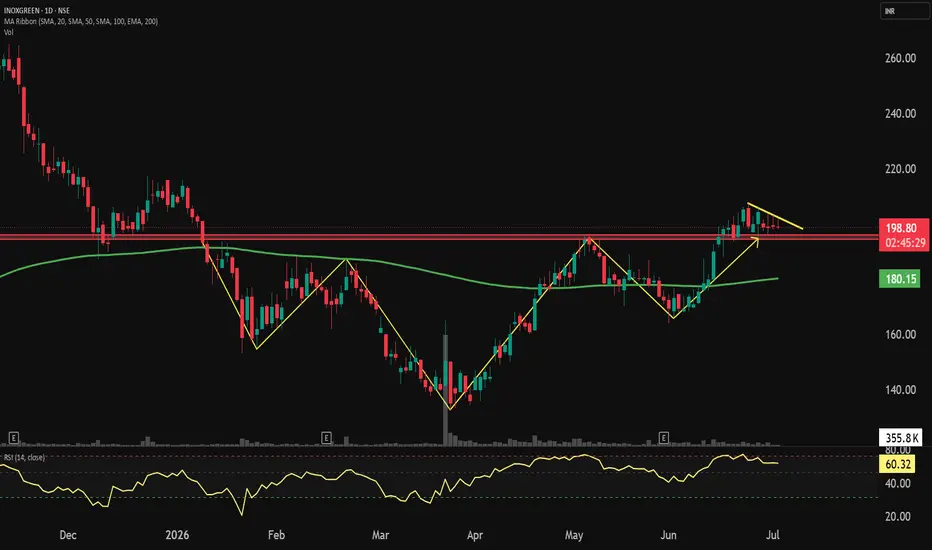
Inox Green has successfully completed an Inverse Head and Shoulder pattern, confirming a bullish reversal from the previous downtrend. The stock has delivered a decisive breakout above the neckline and is now sustaining above the breakout zone.
According to the Polarity Change Theory, an important resistance level often turns into support after a successful breakout. The previous neckline resistance around ₹196–198 is now acting as a strong support zone, improving the probability of further upside as long as price remains above it.
The price structure has also strengthened significantly. The stock has broken its previous swing high and is now forming higher highs and higher lows, confirming the beginning of a bullish trend.
Trend and momentum indicators are also supporting the bullish outlook. The 200 EMA is sloping upward, indicating an improving long-term trend, while the RSI is currently around 60, suggesting healthy bullish momentum without entering the overbought zone.
Outlook: The successful neckline breakout, combined with an improving market structure, rising 200 EMA, and supportive RSI, indicates that buyers remain in control. As long as price sustains above the neckline support, the probability of trend continuation remains favorable.
The neckline should be closely monitored, as holding above this level would further strengthen the bullish case and may provide opportunities for continuation toward higher levels.
Disclaimer: This research is only for educational purposes and not investment advice. Please consult your registered financial advisor before investing. I am only a SEBI Certified Research Analyst.
According to the Polarity Change Theory, an important resistance level often turns into support after a successful breakout. The previous neckline resistance around ₹196–198 is now acting as a strong support zone, improving the probability of further upside as long as price remains above it.
The price structure has also strengthened significantly. The stock has broken its previous swing high and is now forming higher highs and higher lows, confirming the beginning of a bullish trend.
Trend and momentum indicators are also supporting the bullish outlook. The 200 EMA is sloping upward, indicating an improving long-term trend, while the RSI is currently around 60, suggesting healthy bullish momentum without entering the overbought zone.
Outlook: The successful neckline breakout, combined with an improving market structure, rising 200 EMA, and supportive RSI, indicates that buyers remain in control. As long as price sustains above the neckline support, the probability of trend continuation remains favorable.
The neckline should be closely monitored, as holding above this level would further strengthen the bullish case and may provide opportunities for continuation toward higher levels.
Disclaimer: This research is only for educational purposes and not investment advice. Please consult your registered financial advisor before investing. I am only a SEBI Certified Research Analyst.

免責事項
これらの情報および投稿は、TradingViewが提供または承認する金融、投資、取引、またはその他の種類の助言もしくは推奨であることを意図したものではなく、またこれらに該当するものでもありません。詳細は利用規約をご覧ください。
免責事項
これらの情報および投稿は、TradingViewが提供または承認する金融、投資、取引、またはその他の種類の助言もしくは推奨であることを意図したものではなく、またこれらに該当するものでもありません。詳細は利用規約をご覧ください。