
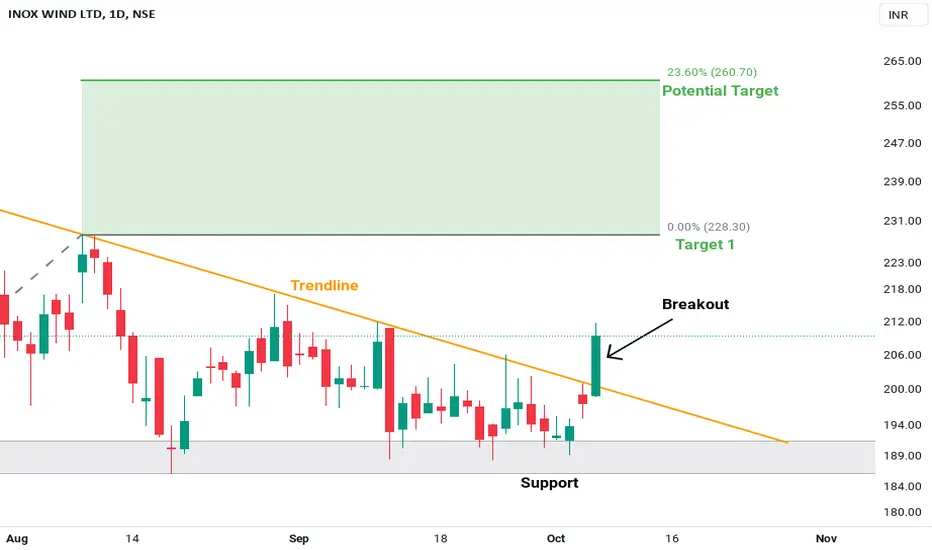
INOXWIND Daily Chart
Technical Data:
1. Breakout of Descending Triangle Pattern
2. Moving Averages Bullish Crossover
3. RSI > 60
Trade Setup:
If the price sustains above 200 and in the breakout zone then the price could see the levels of 228 and then 260
Hit the like button!! Show some energy!!
Disclaimer: This is my pre market analysis and my trading journal. Not a suggestion to buy or sell.
Thanks
Er. Simranjit Singh Virdi
Technical Data:
1. Breakout of Descending Triangle Pattern
2. Moving Averages Bullish Crossover
3. RSI > 60
Trade Setup:
If the price sustains above 200 and in the breakout zone then the price could see the levels of 228 and then 260
Hit the like button!! Show some energy!!
Disclaimer: This is my pre market analysis and my trading journal. Not a suggestion to buy or sell.
Thanks
Er. Simranjit Singh Virdi

関連の投稿
免責事項
これらの情報および投稿は、TradingViewが提供または承認する金融、投資、取引、またはその他の種類の助言もしくは推奨であることを意図したものではなく、またこれらに該当するものでもありません。詳細は利用規約をご覧ください。
関連の投稿
免責事項
これらの情報および投稿は、TradingViewが提供または承認する金融、投資、取引、またはその他の種類の助言もしくは推奨であることを意図したものではなく、またこれらに該当するものでもありません。詳細は利用規約をご覧ください。