
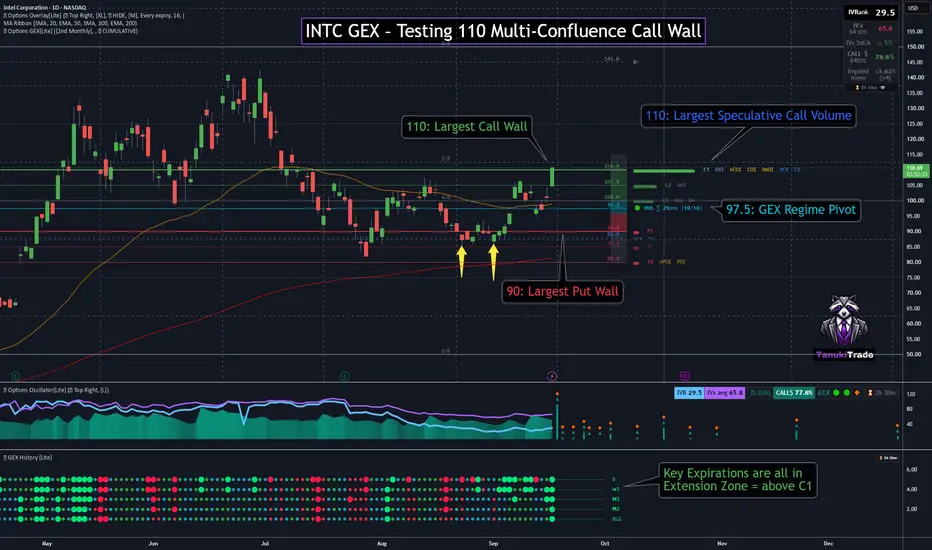
INTC is pressing into 110 on the daily chart after a strong momentum expansion. Spot is only marginally above the level, so this remains a test rather than confirmed acceptance.
The October 16 cumulative GEX profile makes 110 the central decision point. It is the highest call wall and also overlaps a technically important reaction area visible on the daily chart.
🔶 Regime Context 🔶
With price above the 97.5 HVL and the 100 call-cluster boundary, INTC remains in a positive GEX regime.
GEX History shows 0, W1, M1, M2, and ALL aligned in large-green positive extension. This is a dampening-volatility backdrop rather than a directional signal. The current momentum candle is testing C1, but acceptance still requires a sustained hold above 110.
🔶 Options Structure Context 🔶
👉 110 – C1 multi-confluence wall
Confluence at 110:
🔶 Key Structure to Watch 🔶
The key question is whether INTC can turn 110 from resistance into support—or whether this extension test ends in rejection.
The October 16 cumulative GEX profile makes 110 the central decision point. It is the highest call wall and also overlaps a technically important reaction area visible on the daily chart.
🔶 Regime Context 🔶
With price above the 97.5 HVL and the 100 call-cluster boundary, INTC remains in a positive GEX regime.
GEX History shows 0, W1, M1, M2, and ALL aligned in large-green positive extension. This is a dampening-volatility backdrop rather than a directional signal. The current momentum candle is testing C1, but acceptance still requires a sustained hold above 110.
🔶 Options Structure Context 🔶
👉 110 – C1 multi-confluence wall
Confluence at 110:
- C1 — highest call NETGEX
- Ab1 — largest absolute gamma
- nCOI / COI / AbOI — dominant call and absolute open-interest concentration
- CV / PV — largest cumulative call- and put-volume peaks
🔶 Key Structure to Watch 🔶
- Above 110 — sustained acceptance keeps INTC in positive extension, with gamma squeeze potential toward the 115 and 120 secondary NETGEX references
- Below 110 — rejection returns price toward 105, followed by the 100 call-cluster boundary
- 97.5 — HVL and GEX regime pivot
- 90 — strongest put wall (P1)
The key question is whether INTC can turn 110 from resistance into support—or whether this extension test ends in rejection.
トレード稼働中
INTC is in a potential gamma squeeze above 110 Call Wall. 
Boost up your charts with Options PRO!
REAL Options metrics for over 250+ liquid US symbols:
✔ 𝗔𝘂𝘁𝗼-𝗨𝗽𝗱𝗮𝘁𝗶𝗻𝗴 𝗚𝗘𝗫 𝗹𝗲𝘃𝗲𝗹𝘀
✔ GEX ✔ IVRank ✔ CALL/PUT skew ✔ Volatility✔ Delta curves
👉 7-day FREE TRIAL 🌐 TanukiTrade.com
REAL Options metrics for over 250+ liquid US symbols:
✔ 𝗔𝘂𝘁𝗼-𝗨𝗽𝗱𝗮𝘁𝗶𝗻𝗴 𝗚𝗘𝗫 𝗹𝗲𝘃𝗲𝗹𝘀
✔ GEX ✔ IVRank ✔ CALL/PUT skew ✔ Volatility✔ Delta curves
👉 7-day FREE TRIAL 🌐 TanukiTrade.com
関連の投稿
免責事項
これらの情報および投稿は、TradingViewが提供または承認する金融、投資、取引、またはその他の種類の助言もしくは推奨であることを意図したものではなく、またこれらに該当するものでもありません。詳細は利用規約をご覧ください。
Boost up your charts with Options PRO!
REAL Options metrics for over 250+ liquid US symbols:
✔ 𝗔𝘂𝘁𝗼-𝗨𝗽𝗱𝗮𝘁𝗶𝗻𝗴 𝗚𝗘𝗫 𝗹𝗲𝘃𝗲𝗹𝘀
✔ GEX ✔ IVRank ✔ CALL/PUT skew ✔ Volatility✔ Delta curves
👉 7-day FREE TRIAL 🌐 TanukiTrade.com
REAL Options metrics for over 250+ liquid US symbols:
✔ 𝗔𝘂𝘁𝗼-𝗨𝗽𝗱𝗮𝘁𝗶𝗻𝗴 𝗚𝗘𝗫 𝗹𝗲𝘃𝗲𝗹𝘀
✔ GEX ✔ IVRank ✔ CALL/PUT skew ✔ Volatility✔ Delta curves
👉 7-day FREE TRIAL 🌐 TanukiTrade.com
関連の投稿
免責事項
これらの情報および投稿は、TradingViewが提供または承認する金融、投資、取引、またはその他の種類の助言もしくは推奨であることを意図したものではなく、またこれらに該当するものでもありません。詳細は利用規約をご覧ください。