
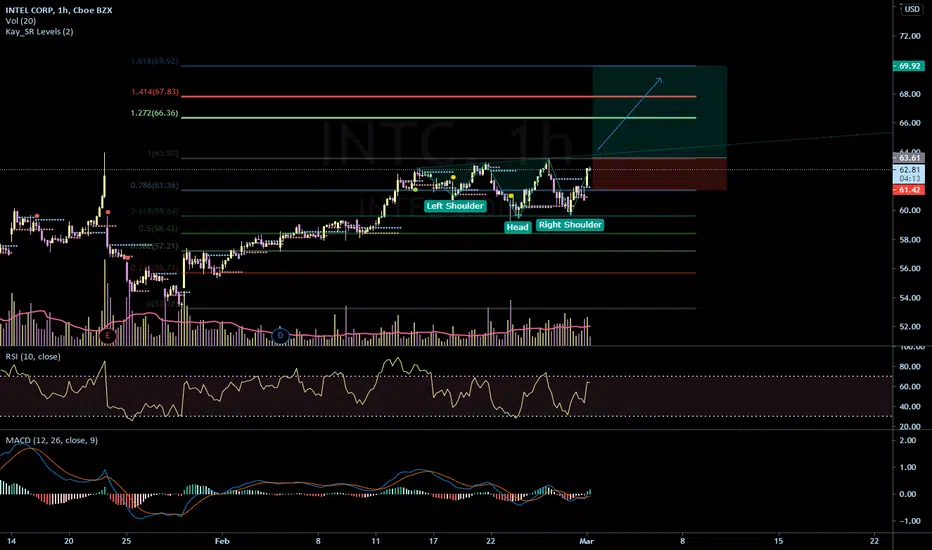
On the 1h chart INTC can be seen forming an inverse Head and Shoulders Pattern, or even a Double Bottom pattern. This is a very bullish sign, with the MACD transitioning into the green. If Intel successfully breaks the 63.57 line, it could go long having price targets of:
$66.30 - $67.80 - $70.00
In my opinion this looks like a very safe bull play on INTC. Always remember to buy the dip, thanks for viewing!
$66.30 - $67.80 - $70.00
In my opinion this looks like a very safe bull play on INTC. Always remember to buy the dip, thanks for viewing!

免責事項
これらの情報および投稿は、TradingViewが提供または承認する金融、投資、取引、またはその他の種類の助言もしくは推奨であることを意図したものではなく、またこれらに該当するものでもありません。詳細は利用規約をご覧ください。
免責事項
これらの情報および投稿は、TradingViewが提供または承認する金融、投資、取引、またはその他の種類の助言もしくは推奨であることを意図したものではなく、またこれらに該当するものでもありません。詳細は利用規約をご覧ください。