The ongoing trade-war with China is proving unfruitful for most tech assets, especially chip/semiconductor suppliers, including  QCOM and
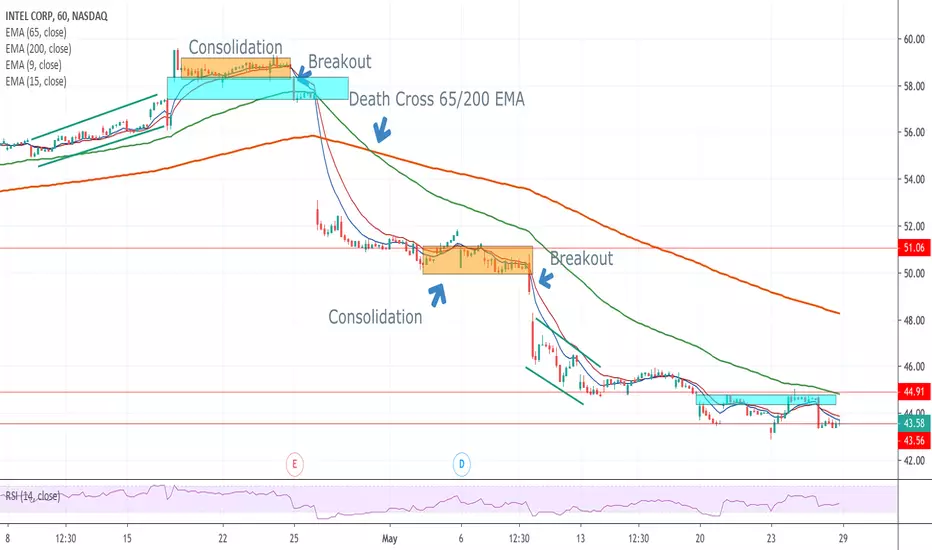
 INTC. Aside from these fundamental negatives, the hourly chart reveals several very simple, basic patterns that provide further confirmation of such bearish sentiment. There are two consolidation-breakout points, both leading to major gaps and spikes in short volume. The death cross, in between, is the cross of the 65-period Exponential Moving Average under the 200, a very strong sell signal. Additionally, the unusually large number of gaps is a sign of volatility and growth-instability.
Traders and investors alike are bearish onINTC due not only to fundamentals but the simple technical indicators and patterns shown on the hourly chart.
QCOM and INTC. Aside from these fundamental negatives, the hourly chart reveals several very simple, basic patterns that provide further confirmation of such bearish sentiment. There are two consolidation-breakout points, both leading to major gaps and spikes in short volume. The death cross, in between, is the cross of the 65-period Exponential Moving Average under the 200, a very strong sell signal. Additionally, the unusually large number of gaps is a sign of volatility and growth-instability. Traders and investors alike are bearish on
INTC due not only to fundamentals but the simple technical indicators and patterns shown on the hourly chart. 
免責事項
これらの情報および投稿は、TradingViewが提供または承認する金融、投資、取引、またはその他の種類の助言もしくは推奨であることを意図したものではなく、またこれらに該当するものでもありません。詳細は利用規約をご覧ください。
免責事項
これらの情報および投稿は、TradingViewが提供または承認する金融、投資、取引、またはその他の種類の助言もしくは推奨であることを意図したものではなく、またこれらに該当するものでもありません。詳細は利用規約をご覧ください。