
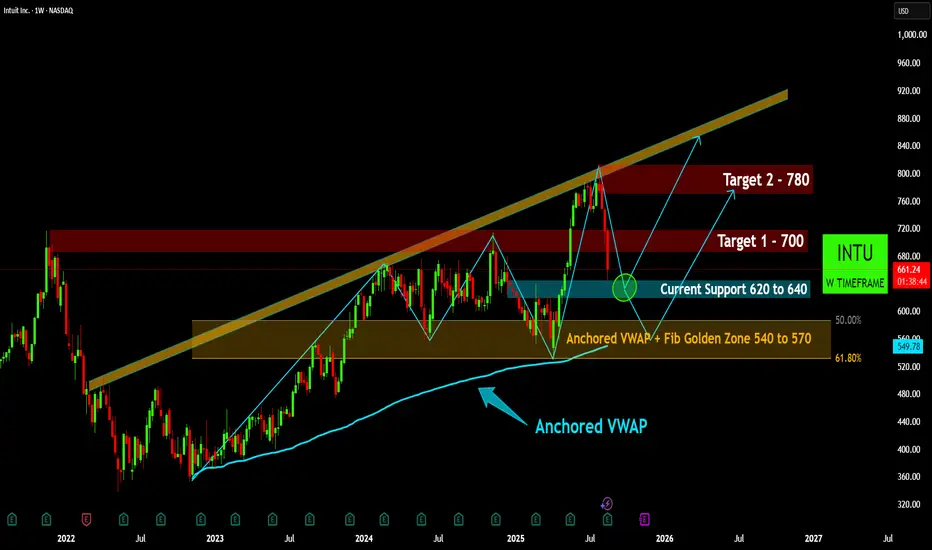
INTU Weekly: Testing Critical Support within Long-Term Uptrend
- INTU demonstrates a robust long-term bullish trend, consistently trading within an upward-sloping channel on the weekly timeframe since early 2023.
- Following a recent peak, the stock is currently testing the "Current Support" zone between
620-640, an important area for potential bounce and trend continuation. - Should the immediate support fail, a more significant and robust support confluence lies within the "Fib Golden Zone" (540-570), reinforced by the long-term Anchored VWAP.
- If current support holds, initial upside targets are identified at $700 (Target 1) and $780 (Target 2), with the potential to eventually re-test the upper boundary of the long-term channel.

免責事項
これらの情報および投稿は、TradingViewが提供または承認する金融、投資、取引、またはその他の種類の助言もしくは推奨であることを意図したものではなく、またこれらに該当するものでもありません。詳細は利用規約をご覧ください。
免責事項
これらの情報および投稿は、TradingViewが提供または承認する金融、投資、取引、またはその他の種類の助言もしくは推奨であることを意図したものではなく、またこれらに該当するものでもありません。詳細は利用規約をご覧ください。