
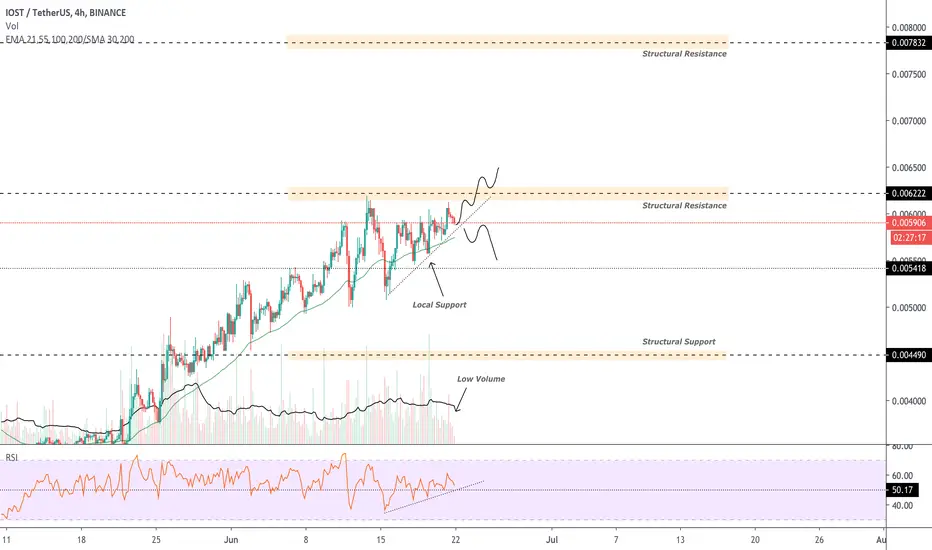
Todays analysis - IOSTUSDT – retracing to local resistance, trading in a bullish ascending triangle.
Points to consider:
- Support and resistance converging (apex)
- Bullish ascending triangle
- Bullish price action
- 55 EMA – Visual guide
- Low volume
- RSI projecting higher lows
IOST consolidating within an ascending triangle nearing its apex where a break in either direction is expected.
Recent price action consisting of higher lows and strong bull moves proceeding weak sell-offs is indicative of a bullish bias in the market.
Trading above the 55 Exponential Moving Average, acting as visual support, price must hold to support the bullish bias.
Volume is clearly declining, indication of an influx being imminent, corresponding with the breakout.
RSI trading is trading above 50, projecting higher lows showing strength in the current market.
Overall, in my opinion, a long trade is validated at the test of local resistance (aggressive entry) and the position may be added to as we verify a successful S/R flip above structural resistance (conservative entry).
What are your thoughts? Let me know in the comments below!
Be sure to leave a like and follow me for daily chart updates.
As always, focus on you - and the money will too!

免責事項
これらの情報および投稿は、TradingViewが提供または承認する金融、投資、取引、またはその他の種類の助言もしくは推奨であることを意図したものではなく、またこれらに該当するものでもありません。詳細は利用規約をご覧ください。
免責事項
これらの情報および投稿は、TradingViewが提供または承認する金融、投資、取引、またはその他の種類の助言もしくは推奨であることを意図したものではなく、またこれらに該当するものでもありません。詳細は利用規約をご覧ください。