
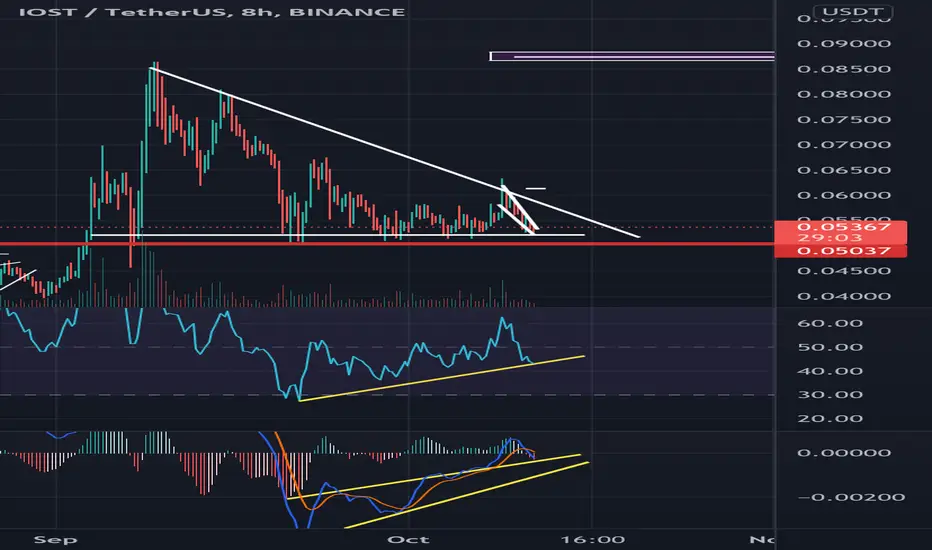
IOST at bottom of Triangle Pattern that has held the bottom above $0.05000 since 09/07/21. Exaggerated Divergence on 8 hour chart on MACD, RSI, and Histogram. Also in smaller falling wedge pattern on smaller time frame with brake out bringing price action out of triangle pattern to $0.06100. Probably see some resistance around there. Then possibly up to $0.085 plus.

免責事項
これらの情報および投稿は、TradingViewが提供または承認する金融、投資、取引、またはその他の種類の助言もしくは推奨であることを意図したものではなく、またこれらに該当するものでもありません。詳細は利用規約をご覧ください。
免責事項
これらの情報および投稿は、TradingViewが提供または承認する金融、投資、取引、またはその他の種類の助言もしくは推奨であることを意図したものではなく、またこれらに該当するものでもありません。詳細は利用規約をご覧ください。