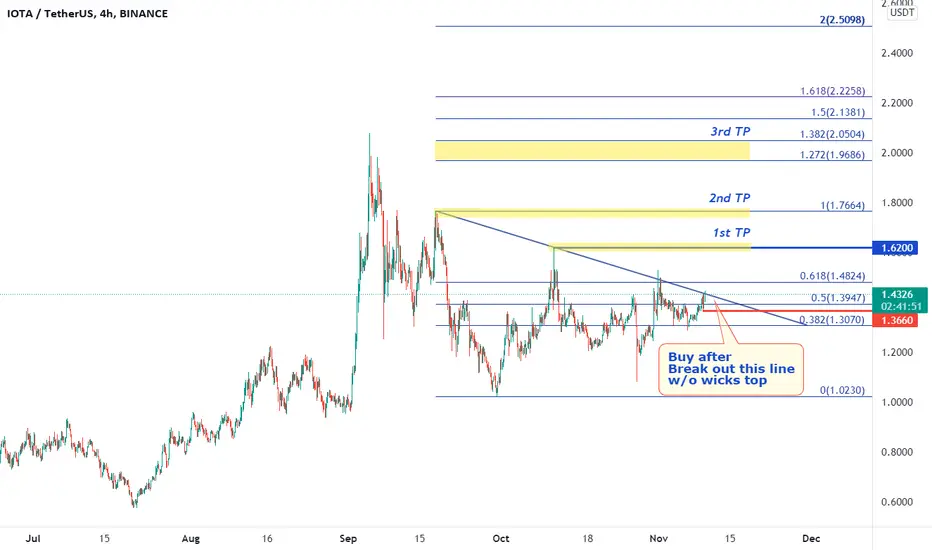

 IOTAUSDT
4H trend chart
-
IOTA has been consolidating and converging.
Now, it is trying to take out the upper downtrend line, but we shall be aware of fake-out in 4H chart.
If price can break out the downtrend line around here, trading strategy as below.
-
Profit Targets:
a) 1.62----Blue horizontal ray
a) 1.7664---Fib(1)
b) 1.9686~2.0504----Fib(1.272~1.382)
Stop losses:
a) 1.366-----Red horizontal ray
-
If you like this analysis, smash the "like button" and leave a comment below to share your thoughts
or let me know what crypto you want to see!
Trading is a reflection of yourself. Learn more daily and be ready for every opportunity.
Have a nice trading!

免責事項
これらの情報および投稿は、TradingViewが提供または承認する金融、投資、取引、またはその他の種類の助言もしくは推奨であることを意図したものではなく、またこれらに該当するものでもありません。詳細は利用規約をご覧ください。
免責事項
これらの情報および投稿は、TradingViewが提供または承認する金融、投資、取引、またはその他の種類の助言もしくは推奨であることを意図したものではなく、またこれらに該当するものでもありません。詳細は利用規約をご覧ください。