
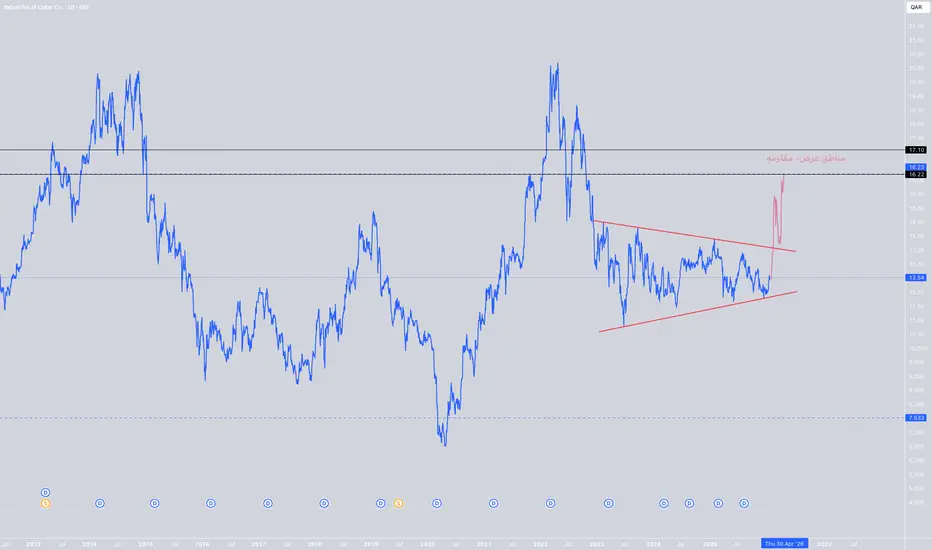
Stock: Industries Qatar
🔹 Big Picture
The stock has been in a broad sideways range since the 2022 peak.
Price is currently moving inside a symmetrical triangle (higher lows + lower highs).
This structure usually represents accumulation before a strong move.
🔹 Key Price Levels
🟥 Resistance / Supply Zones
16.20 – 16.30
Major resistance + upper boundary of the supply zone.
17.10
Very strong historical resistance (previous major peak).
🟩 Support Zones
12.20 – 12.40
Current support + lower boundary of the triangle.
11.00 – 10.80
Medium-term support.
7.50 – 7.60
Long-term historical support (only in a deep bearish scenario).
🔹 Expected Scenarios
✅ Bullish Scenario (Technically Favored)
Clear breakout and weekly close above 16.30
Upside targets:
🎯 17.10
🎯 18.80
🎯 20.00+ (medium-term)
📌 Fits well with QGMD’s nature as a dividend + steady growth stock.
⚠️ Bearish Scenario
Weekly close below 12.20
Downside targets:
11.00
Then 10.00 – 9.50
This scenario remains less likely as long as price holds inside the triangle.
🔹 Important Note
Current price action shows volatility compression.
The longer the price stays inside the triangle → the stronger the eventual breakout.
Not ideal for short-term scalping, but very suitable for strategic positioning.
🎯 Summary
Technically: Accumulation phase
Smart approach:
Trader → wait for 16.30 breakout
Investor → accumulate near support with patience
🔹 Big Picture
The stock has been in a broad sideways range since the 2022 peak.
Price is currently moving inside a symmetrical triangle (higher lows + lower highs).
This structure usually represents accumulation before a strong move.
🔹 Key Price Levels
🟥 Resistance / Supply Zones
16.20 – 16.30
Major resistance + upper boundary of the supply zone.
17.10
Very strong historical resistance (previous major peak).
🟩 Support Zones
12.20 – 12.40
Current support + lower boundary of the triangle.
11.00 – 10.80
Medium-term support.
7.50 – 7.60
Long-term historical support (only in a deep bearish scenario).
🔹 Expected Scenarios
✅ Bullish Scenario (Technically Favored)
Clear breakout and weekly close above 16.30
Upside targets:
🎯 17.10
🎯 18.80
🎯 20.00+ (medium-term)
📌 Fits well with QGMD’s nature as a dividend + steady growth stock.
⚠️ Bearish Scenario
Weekly close below 12.20
Downside targets:
11.00
Then 10.00 – 9.50
This scenario remains less likely as long as price holds inside the triangle.
🔹 Important Note
Current price action shows volatility compression.
The longer the price stays inside the triangle → the stronger the eventual breakout.
Not ideal for short-term scalping, but very suitable for strategic positioning.
🎯 Summary
Technically: Accumulation phase
Smart approach:
Trader → wait for 16.30 breakout
Investor → accumulate near support with patience

免責事項
これらの情報および投稿は、TradingViewが提供または承認する金融、投資、取引、またはその他の種類の助言もしくは推奨であることを意図したものではなく、またこれらに該当するものでもありません。詳細は利用規約をご覧ください。
免責事項
これらの情報および投稿は、TradingViewが提供または承認する金融、投資、取引、またはその他の種類の助言もしくは推奨であることを意図したものではなく、またこれらに該当するものでもありません。詳細は利用規約をご覧ください。