
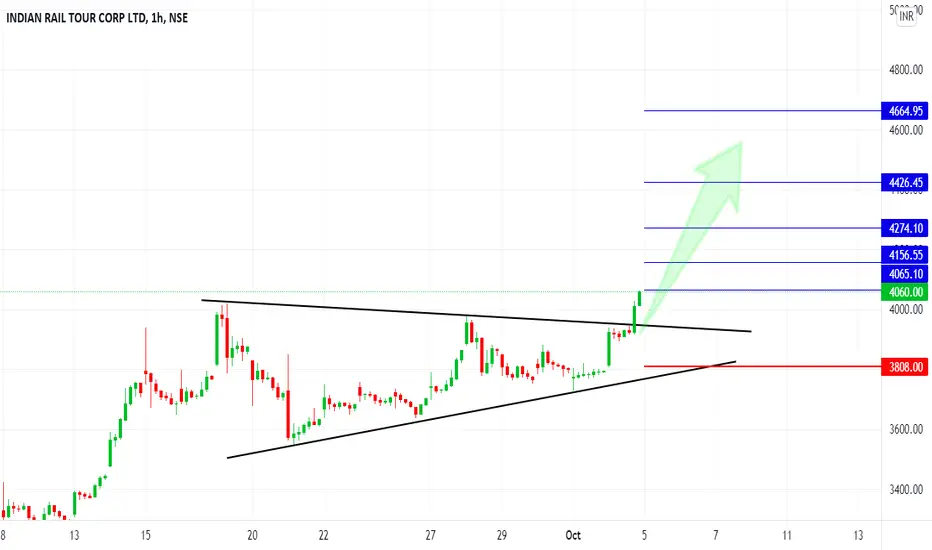
This stock has already shown uptrend, and now after consolidating as a flag pattern, it has given breakout with volume in hourly time frame as well as daily time frame also, all the key levels are mentioned on chart, one can go long with mentioned stoploss for mentioned targets.
key levels are mentioned on chart

flag breakout on hourly chart with very good intensity of volume

flag and pole chart pattern on daily chart

macd in weekly positive and uptick

macd in daily uptick above zero line

macd in hourly positive crossover and uptick above zero line

rsi in daily positive and uptick

rsi in hourly positive and uptick

stochastic turned positive crossover in oversold zones in daily time frame
dmi adx positive ungali setup in hourly chart

bbc in hourly

Disclaimer
I am not sebi registered analyst
My studies are for educational purpose only
Consult your financial advisor before trading or investing
key levels are mentioned on chart
flag breakout on hourly chart with very good intensity of volume
flag and pole chart pattern on daily chart
macd in weekly positive and uptick
macd in daily uptick above zero line
macd in hourly positive crossover and uptick above zero line
rsi in daily positive and uptick
rsi in hourly positive and uptick
stochastic turned positive crossover in oversold zones in daily time frame
dmi adx positive ungali setup in hourly chart
bbc in hourly
Disclaimer
I am not sebi registered analyst
My studies are for educational purpose only
Consult your financial advisor before trading or investing

YouTube: youtube.com/@rk_charts
Telegram : t.me/RK_Charts
Twitter : @charts_rk
Email : rkcharts@gmail. com
Disclaimer.
I am not sebi registered analyst.
My studies are for educational purpose only.
Telegram : t.me/RK_Charts
Twitter : @charts_rk
Email : rkcharts@gmail. com
Disclaimer.
I am not sebi registered analyst.
My studies are for educational purpose only.
関連の投稿
免責事項
これらの情報および投稿は、TradingViewが提供または承認する金融、投資、取引、またはその他の種類の助言もしくは推奨であることを意図したものではなく、またこれらに該当するものでもありません。詳細は利用規約をご覧ください。
YouTube: youtube.com/@rk_charts
Telegram : t.me/RK_Charts
Twitter : @charts_rk
Email : rkcharts@gmail. com
Disclaimer.
I am not sebi registered analyst.
My studies are for educational purpose only.
Telegram : t.me/RK_Charts
Twitter : @charts_rk
Email : rkcharts@gmail. com
Disclaimer.
I am not sebi registered analyst.
My studies are for educational purpose only.
関連の投稿
免責事項
これらの情報および投稿は、TradingViewが提供または承認する金融、投資、取引、またはその他の種類の助言もしくは推奨であることを意図したものではなく、またこれらに該当するものでもありません。詳細は利用規約をご覧ください。