 IRDM
IRDM Technicals:
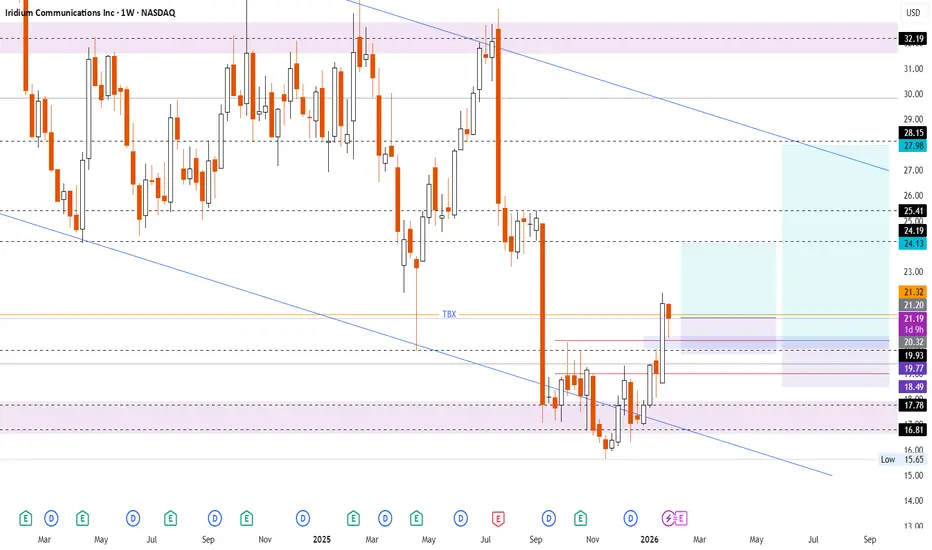
- September - January the price failed to break through the support zone 16.80 - 18.00
- strong weekly candle closed above 19.90 ressistance (there since Jul 2018)
- 20.10 - 20.40 can still be retested
- upswing to close Sep 8th weekly candle looks logical
- best-case scenario targets long-term bear trend upper resistance line
- take care of 24.20 - 25.40 resistance zone - partial close preferred
- scenario invalidated if two bars close below 19.00 - price can retest support zone 16.80 - 17.80
Fundamentals:
- company emerged from bankruptcy and has successfully returned to profitability.
- business model centers on providing connectivity via its orbital satellite constellation for tasks such as tracking shipping containers at sea and monitoring pipelines for both government and private-sector clients
- has long-term, fixed-price contracts with the U.S. Department of Defense.
- due to the modern state of its satellite fleet, free cash flow is being directed toward share buybacks and dividends rather than capital expenditures on new rocket launches.
but:
- competition with Starlink for the retail user segment and partial dependency on third-party aerospace companies for orbital satellite deployment.
Conclusion:
- fundamentally, the company is a prominent representative of the aerospace industry during its "renaissance" era (which is now and potentially has bright future).
- with effective management, the stock price has the potential for multi-bagger growth over time.
- the technical setup remains in a bearish trend.
- t here are two distinct positions available: one for high-risk traders and another for patient, long-term investors. For short-term traders, the risk of a further drawdown or a retest of support zones remains high. For long-term traders or investors, an entry price within the $16.00 – $22.00 range is considered attractive.
but:
- the upcoming earnings report on Feb 12th will be the primary catalyst determining the price direction in the short-to-medium term.
# - - - - -
Position - Buy Long ⬆️
# - - - - -
✅ Entry Point 1 Short Term - 21.19
🛑 SL Short Term - 19.75
🤑 TP Short Term - 24.15
⚙️ Risk/Reward - 1 : 2.05 👌
⌛️ Timeframe - 2 weeks 🗓
# - - - - -
✅ Entry Point 2 Middle Term - 20.20
🛑 SL Long term - 18.50
🤑 TP Long Term - 27.95
⚙️ Risk/Reward - 1 : 4.15 👌
⌛️ Timeframe - 3-4 months 🗓
# - - - - -
Good Luck! ☺️
ノート
DISCLAIMER: Not financial advice. Everyone must make trading decisions at their own risk, guided only by their own criteria and strategy for opening or not opening a trade.トレード稼働中
ノート
Entry Point 1 - Trade closed by stopEntry Point 2 - Trade active
ノート
Today, February 12, 2026, the company released its financial results and earnings guidance. A strong daily bounce of over 10% serves as a convincing signal for at least not bad results. Should the price hold above the [19.90, 20.50] support zone, the asset is expected to test the resistance level at 25.42P.S. Be aware that such strong movements intraday can lead to profit-taking in following trading sessions
ノート
Price reached 1st Take-ProfitFixed 50% at 24.15
Price is targeting resistance at 25.42
ノート
For those who is still watching - the price is approaching the upper bound retest of the bearish channel in the nearest termトレード終了: 利益確定目標に到達
It took so long... But the price finally reached the second target. Trading position closed, investing position still open
Visit my Risk Enforcement App → mywarner.app/
Follow me on Telegram → t.me/totsamiykaa
Watch me on YT → youtube.com/@totsamiykaa
See me on Threads → threads.com/@totsamiykaa
Follow me on Telegram → t.me/totsamiykaa
Watch me on YT → youtube.com/@totsamiykaa
See me on Threads → threads.com/@totsamiykaa
免責事項
これらの情報および投稿は、TradingViewが提供または承認する金融、投資、取引、またはその他の種類の助言もしくは推奨であることを意図したものではなく、またこれらに該当するものでもありません。詳細は利用規約をご覧ください。
Visit my Risk Enforcement App → mywarner.app/
Follow me on Telegram → t.me/totsamiykaa
Watch me on YT → youtube.com/@totsamiykaa
See me on Threads → threads.com/@totsamiykaa
Follow me on Telegram → t.me/totsamiykaa
Watch me on YT → youtube.com/@totsamiykaa
See me on Threads → threads.com/@totsamiykaa
免責事項
これらの情報および投稿は、TradingViewが提供または承認する金融、投資、取引、またはその他の種類の助言もしくは推奨であることを意図したものではなく、またこれらに該当するものでもありません。詳細は利用規約をご覧ください。