
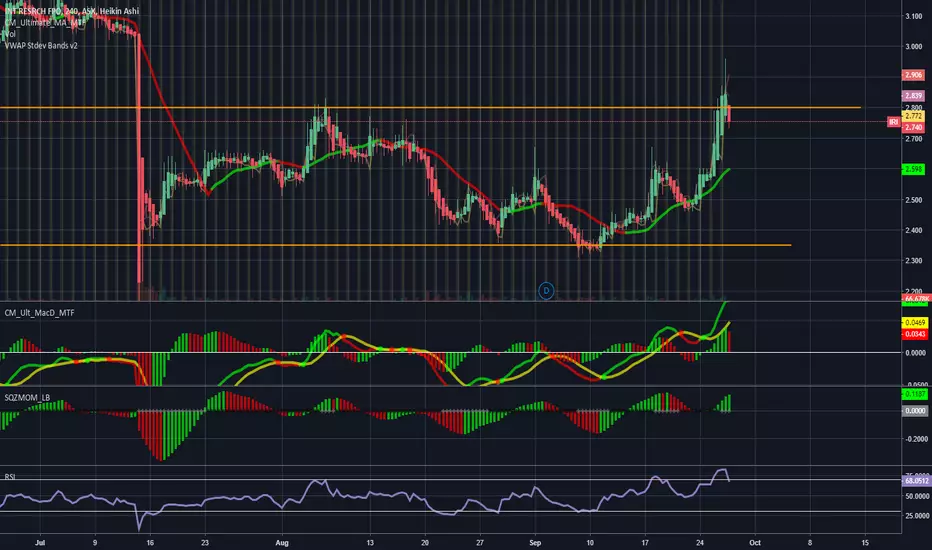
- Offers 15% potential between top and bottom drawn support and resistance
- If it makes higher highs past $3 then continue to be patient and wait for further higher highs and higher lows to confirm that it's on the uptrend before getting in for a swing trade
- On the weekly chart, IRI is in a down trend and is hitting the moving average line, so wait and see if it can bust through that or if it is just going to get rejected

免責事項
これらの情報および投稿は、TradingViewが提供または承認する金融、投資、取引、またはその他の種類の助言もしくは推奨であることを意図したものではなく、またこれらに該当するものでもありません。詳細は利用規約をご覧ください。
免責事項
これらの情報および投稿は、TradingViewが提供または承認する金融、投資、取引、またはその他の種類の助言もしくは推奨であることを意図したものではなく、またこれらに該当するものでもありません。詳細は利用規約をご覧ください。