
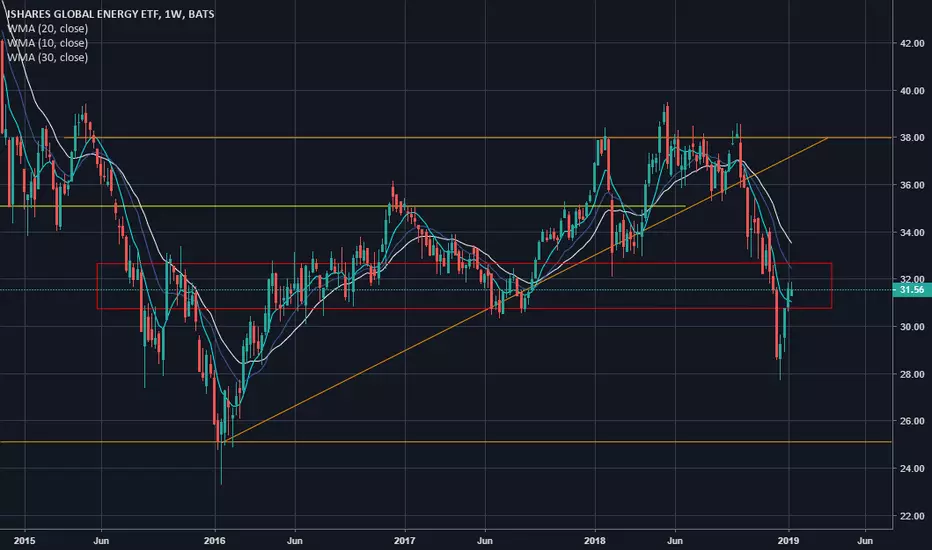
Finding different weekly support and resistance levels dating back to 2008. I am marking levels that have confirmed the price getting caught in, then when breaking either up or down it will continue that way for a short period of time. Next I will show a daily projection based off of the levels I have found.

免責事項
これらの情報および投稿は、TradingViewが提供または承認する金融、投資、取引、またはその他の種類の助言もしくは推奨であることを意図したものではなく、またこれらに該当するものでもありません。詳細は利用規約をご覧ください。
免責事項
これらの情報および投稿は、TradingViewが提供または承認する金融、投資、取引、またはその他の種類の助言もしくは推奨であることを意図したものではなく、またこれらに該当するものでもありません。詳細は利用規約をご覧ください。