
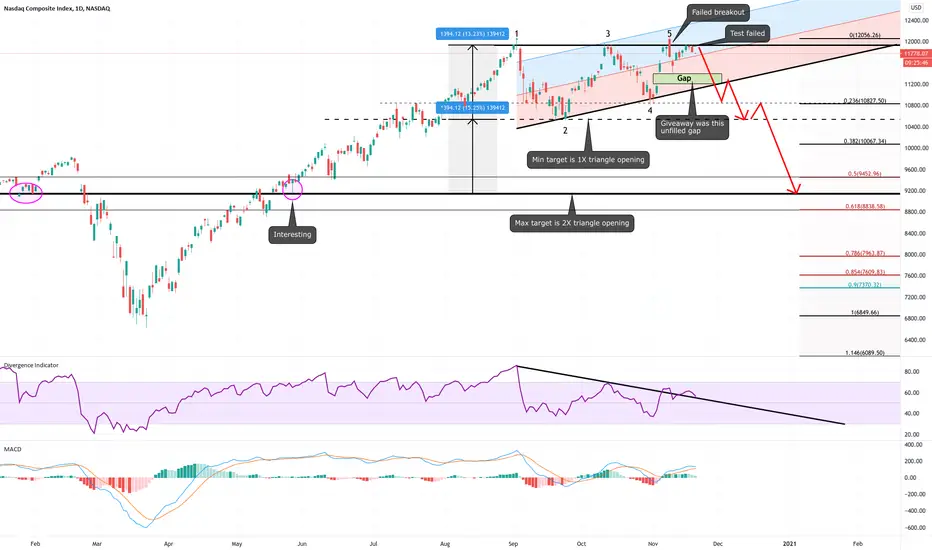
What I see is a failed breakout of an ascending triangle (not a bullish pennant). The NASDAQ tried for a week to get back up there and hold, but no dice. Thus, it becomes a bearish reversal pattern that typically signifies a top. Short of some more irrational FOMO (I am not completely discounting this), I think the NASDAQ is headed for a sizable correction. The other thing that leads me to believe this is the large gap up that was not filled and large indices like the NASDAQ always seem to fill gaps. See notes on chart.
Watch and see what it does when it reaches the center of the regression channel (break up or down). Also watch those thin black trend lines I drew.

Hope it helps and good luck.
Watch and see what it does when it reaches the center of the regression channel (break up or down). Also watch those thin black trend lines I drew.
Hope it helps and good luck.

関連の投稿
免責事項
これらの情報および投稿は、TradingViewが提供または承認する金融、投資、取引、またはその他の種類の助言もしくは推奨であることを意図したものではなく、またこれらに該当するものでもありません。詳細は利用規約をご覧ください。
関連の投稿
免責事項
これらの情報および投稿は、TradingViewが提供または承認する金融、投資、取引、またはその他の種類の助言もしくは推奨であることを意図したものではなく、またこれらに該当するものでもありません。詳細は利用規約をご覧ください。