
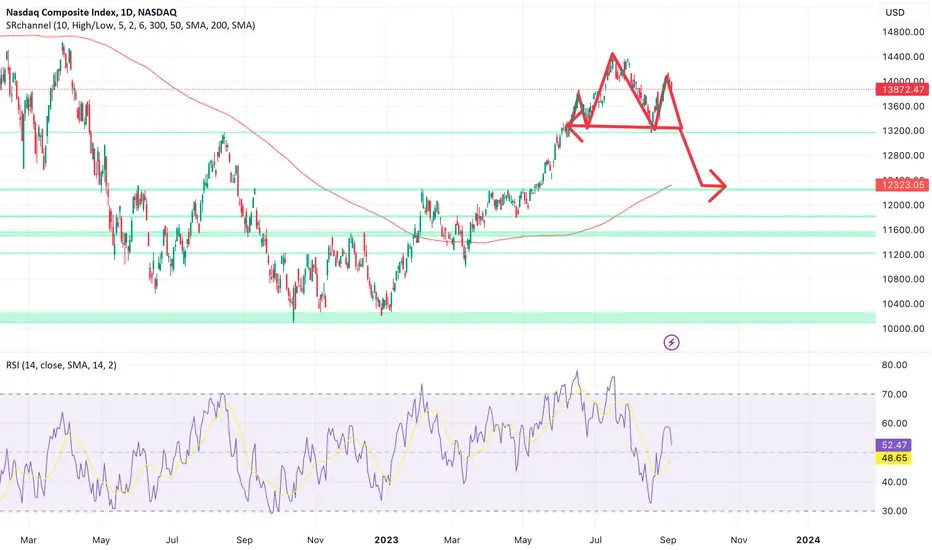
NASDAQ is forming a potential head and shoulder pattern
The neck line of this shoulder is 13247
If it goes below that or the daily candle close below that level that means the bearish trend will start
Looking @ DXY also it seems it is coinciding as usual with the potential down turn of the market .
20 Sept is the Fed event and that can bring the news to push the market down
The strong support level is 12289 level
Anything around 12k area should be a strong buy as the bound from this level would be amazing,
The neck line of this shoulder is 13247
If it goes below that or the daily candle close below that level that means the bearish trend will start
Looking @ DXY also it seems it is coinciding as usual with the potential down turn of the market .
20 Sept is the Fed event and that can bring the news to push the market down
The strong support level is 12289 level
Anything around 12k area should be a strong buy as the bound from this level would be amazing,
ノート
So it has indeed crossed the neck line and looks like we are going to go back to 12800 or 12300 levels . Great shopping time coming ahead
免責事項
これらの情報および投稿は、TradingViewが提供または承認する金融、投資、取引、またはその他の種類の助言もしくは推奨であることを意図したものではなく、またこれらに該当するものでもありません。詳細は利用規約をご覧ください。
免責事項
これらの情報および投稿は、TradingViewが提供または承認する金融、投資、取引、またはその他の種類の助言もしくは推奨であることを意図したものではなく、またこれらに該当するものでもありません。詳細は利用規約をご覧ください。