
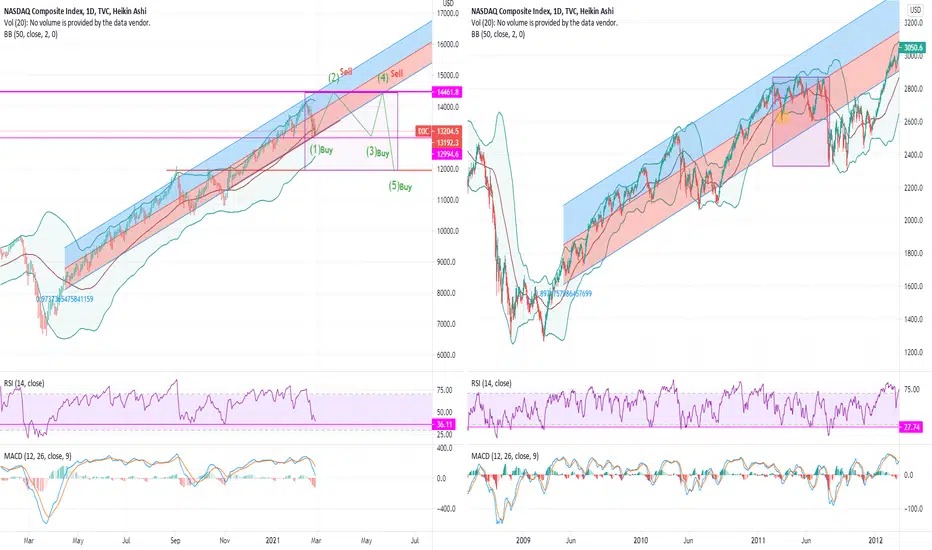
This is my favorite analysis
I give my qualified bid here on how NASDAQ and the market are going to evolve.
the graph is very similar to the financial crisis and makes exactly the same pattern, on top, bottom, RSI and MACD.
10-y bond have fallen and as I wrote in my other analysis, bonds will return to 0.95 and up again to 1.5. it's making a cup and handle now.
Follow the dates on the 1,2,3,4,5 wave and compare it with 10-y bond, and financial crisis(15. march 2011 to 17. june 2011).
I give my qualified bid here on how NASDAQ and the market are going to evolve.
the graph is very similar to the financial crisis and makes exactly the same pattern, on top, bottom, RSI and MACD.
10-y bond have fallen and as I wrote in my other analysis, bonds will return to 0.95 and up again to 1.5. it's making a cup and handle now.
Follow the dates on the 1,2,3,4,5 wave and compare it with 10-y bond, and financial crisis(15. march 2011 to 17. june 2011).

関連の投稿
免責事項
これらの情報および投稿は、TradingViewが提供または承認する金融、投資、取引、またはその他の種類の助言もしくは推奨であることを意図したものではなく、またこれらに該当するものでもありません。詳細は利用規約をご覧ください。
免責事項
これらの情報および投稿は、TradingViewが提供または承認する金融、投資、取引、またはその他の種類の助言もしくは推奨であることを意図したものではなく、またこれらに該当するものでもありません。詳細は利用規約をご覧ください。