
Good evening?
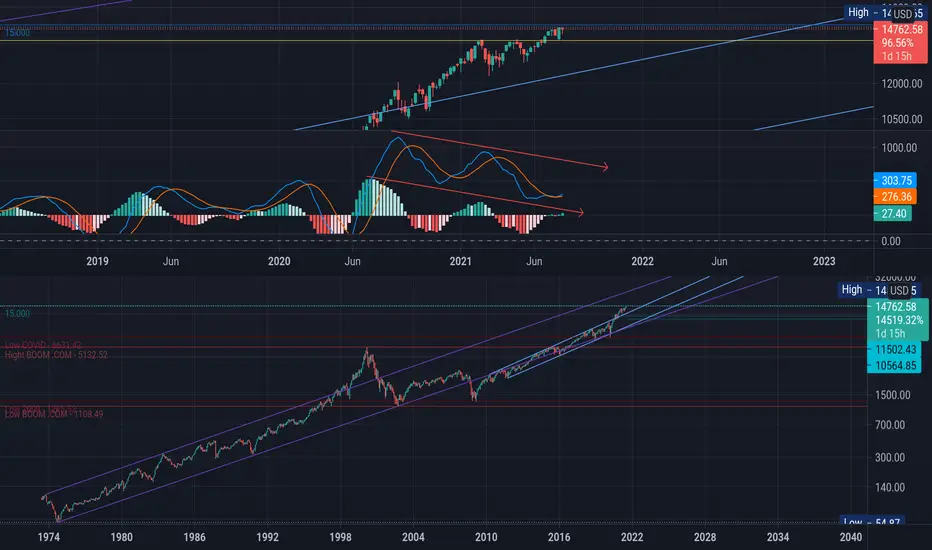
Signals to sell NASDAQ in general and BigTech shares in particular:
1. Round price of $ 15,000 = resistance.
2. Strong bearish MACD divergence on the weekly chart.
3. Beginning of bearish MACD divergence on slower monthly chart.
4. Bull trap - upward breakout of the resistance of the double top (yellow line).
Therefore, we can expect a Fibonacci correction from 30-50% to the $ 11.5k-10.5k range.
Not a financial recommendation.
GET RICH OR DIE TRYIN.
Signals to sell NASDAQ in general and BigTech shares in particular:
1. Round price of $ 15,000 = resistance.
2. Strong bearish MACD divergence on the weekly chart.
3. Beginning of bearish MACD divergence on slower monthly chart.
4. Bull trap - upward breakout of the resistance of the double top (yellow line).
Therefore, we can expect a Fibonacci correction from 30-50% to the $ 11.5k-10.5k range.
Not a financial recommendation.
GET RICH OR DIE TRYIN.

免責事項
これらの情報および投稿は、TradingViewが提供または承認する金融、投資、取引、またはその他の種類の助言もしくは推奨であることを意図したものではなく、またこれらに該当するものでもありません。詳細は利用規約をご覧ください。
免責事項
これらの情報および投稿は、TradingViewが提供または承認する金融、投資、取引、またはその他の種類の助言もしくは推奨であることを意図したものではなく、またこれらに該当するものでもありません。詳細は利用規約をご覧ください。