
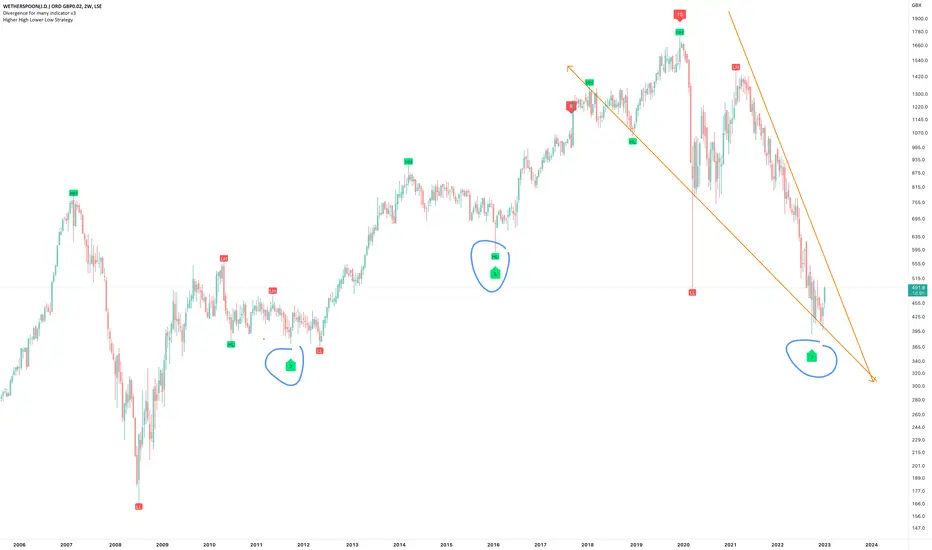
On the above 2-week chart price action has corrected 75% since the sell signal (not shown) in October 2019 @ 1600. Now is an excellent moment for a long trade position. Why?
1) A strong buy prints (not shown).
2) Strong bullish divergence. Blue circles. Look left.
3) Falling wedge is yet to breakout however with points 1 and 2 we can be confident in the direction.
4) The UK economy is circling the drain hole, it makes sense alcohol consumption will be on the up!
Is it possible for price action to fall further? For sure.
Is it probable? No.
Ww
Type: trade. Yes trade, not investment.
Risk: <=6% of portfolio
Timeframe: Don’t know.
Return: Don’t know
Stop loss: <=$380
1) A strong buy prints (not shown).
2) Strong bullish divergence. Blue circles. Look left.
3) Falling wedge is yet to breakout however with points 1 and 2 we can be confident in the direction.
4) The UK economy is circling the drain hole, it makes sense alcohol consumption will be on the up!
Is it possible for price action to fall further? For sure.
Is it probable? No.
Ww
Type: trade. Yes trade, not investment.
Risk: <=6% of portfolio
Timeframe: Don’t know.
Return: Don’t know
Stop loss: <=$380
ノート
** Swing trade opportunity **Price action is up 60% and overbought. Wait for 550 and below. Not trading this so you must ask below for an update.
手動でトレードを終了しました
50% win since the start of the year. Strong probability price action now corrects.2-week
トレード稼働中
WAVE 3 underway.
免責事項
これらの情報および投稿は、TradingViewが提供または承認する金融、投資、取引、またはその他の種類の助言もしくは推奨であることを意図したものではなく、またこれらに該当するものでもありません。詳細は利用規約をご覧ください。
免責事項
これらの情報および投稿は、TradingViewが提供または承認する金融、投資、取引、またはその他の種類の助言もしくは推奨であることを意図したものではなく、またこれらに該当するものでもありません。詳細は利用規約をご覧ください。