Tony's Picks
I have recently started analyzing charts and have come across this interesting idea.
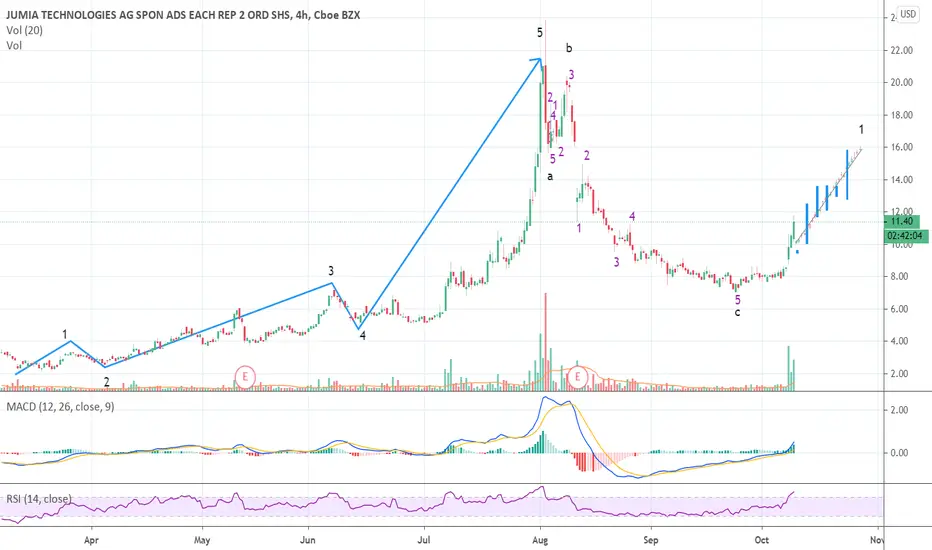
This chart is on the 4hr time frame. It looks like JMIA is about to enter wave 1 after a 5-3-5 zig zag countertrend according to the Elliot wave theory. This idea assumes everything prior to this trend was just an IPO countertrend. Wave 2 two bounces off the .618 from wave 1 fib retracement perfectly. On the weekly chart it could be argued that we are still in one large wave 1 on macro level. I could see a $16 price target being realistic based off this chart. Expect volatility as JMIA still has a lot to prove.
Curious to thoughts and comments.
Thank you.
I have recently started analyzing charts and have come across this interesting idea.
This chart is on the 4hr time frame. It looks like
JMIA is about to enter wave 1 after a 5-3-5 zig zag countertrend according to the Elliot wave theory. This idea assumes everything prior to this trend was just an IPO countertrend. Wave 2 two bounces off the .618 from wave 1 fib retracement perfectly. On the weekly chart it could be argued that we are still in one large wave 1 on macro level. I could see a $16 price target being realistic based off this chart. Expect volatility as JMIA still has a lot to prove. Curious to thoughts and comments.
Thank you.

免責事項
これらの情報および投稿は、TradingViewが提供または承認する金融、投資、取引、またはその他の種類の助言もしくは推奨であることを意図したものではなく、またこれらに該当するものでもありません。詳細は利用規約をご覧ください。
免責事項
これらの情報および投稿は、TradingViewが提供または承認する金融、投資、取引、またはその他の種類の助言もしくは推奨であることを意図したものではなく、またこれらに該当するものでもありません。詳細は利用規約をご覧ください。