
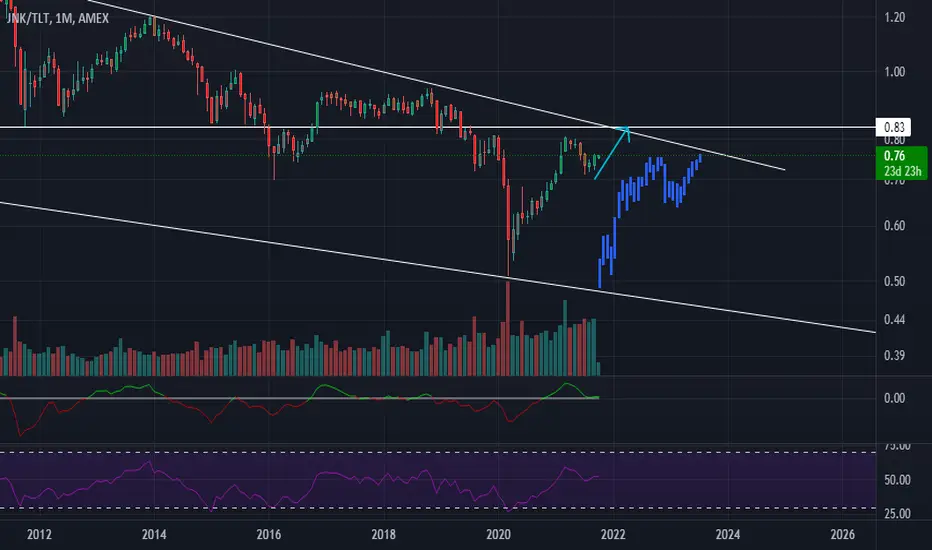
The JNK/TLT ratio chart visualizes investors' position in greed and safe bonds. An increase means more greed in the market, corresponding with an increase in equities. Based on where we are, I am expecting one last run in the stock market, reaching the top of our resistance trend-line. I have added a fractal to support this thesis.

免責事項
これらの情報および投稿は、TradingViewが提供または承認する金融、投資、取引、またはその他の種類の助言もしくは推奨であることを意図したものではなく、またこれらに該当するものでもありません。詳細は利用規約をご覧ください。
免責事項
これらの情報および投稿は、TradingViewが提供または承認する金融、投資、取引、またはその他の種類の助言もしくは推奨であることを意図したものではなく、またこれらに該当するものでもありません。詳細は利用規約をご覧ください。