What's up everyone, I'm back with some quick update on $JPM.
Quick fact: The 65-minute chart has 6 evenly sized candles (65 x 6 = 390, amt of mins per day).
Based on our previous analysis:
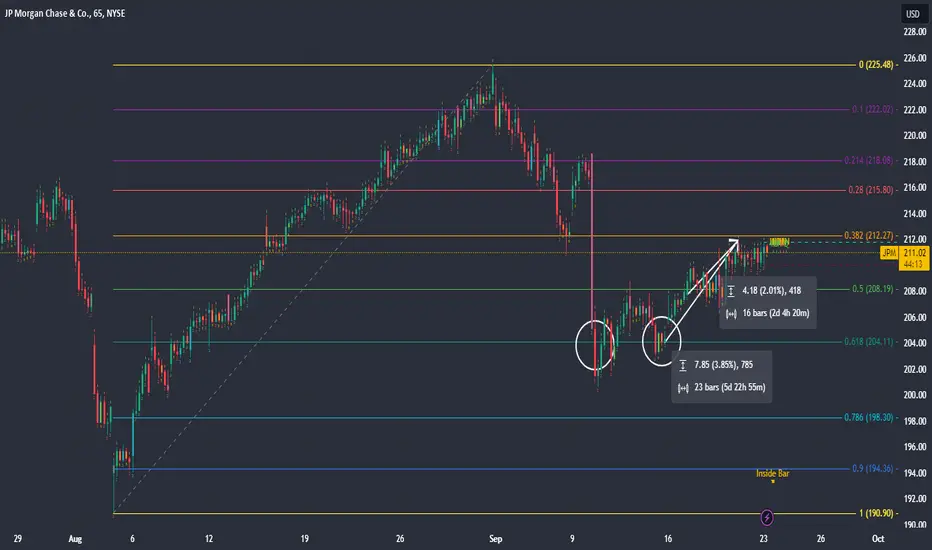
- JPM has bounced off the 0.618 bullish Fibonacci on the 65-minute chart at $204.11
- Price Target of $225.48 at 0.0 (assuming we continue the bullish trend)
- Stop Loss of $194.36 at the 0.9 bullish Fibonacci
The price is currently up 2% from when we first analyzed the stock and 3.85% from the last time it touched 0.618.
If you're in the play, stay the course, move your stop loss to 0.5 Fibonacci if you want to decrease your risk. If not, hold on.
I'm not in the play.
Quick fact: The 65-minute chart has 6 evenly sized candles (65 x 6 = 390, amt of mins per day).
Based on our previous analysis:
-
JPM has bounced off the 0.618 bullish Fibonacci on the 65-minute chart at $204.11- Price Target of $225.48 at 0.0 (assuming we continue the bullish trend)
- Stop Loss of $194.36 at the 0.9 bullish Fibonacci
The price is currently up 2% from when we first analyzed the stock and 3.85% from the last time it touched 0.618.
If you're in the play, stay the course, move your stop loss to 0.5 Fibonacci if you want to decrease your risk. If not, hold on.
I'm not in the play.

関連の投稿
免責事項
これらの情報および投稿は、TradingViewが提供または承認する金融、投資、取引、またはその他の種類の助言もしくは推奨であることを意図したものではなく、またこれらに該当するものでもありません。詳細は利用規約をご覧ください。
免責事項
これらの情報および投稿は、TradingViewが提供または承認する金融、投資、取引、またはその他の種類の助言もしくは推奨であることを意図したものではなく、またこれらに該当するものでもありません。詳細は利用規約をご覧ください。