

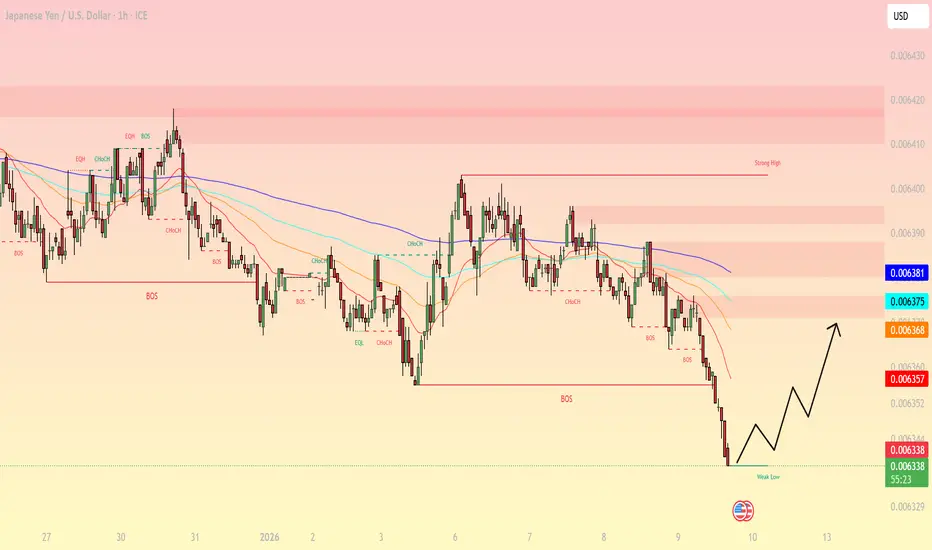
JPYUSD 1H Technical Analysis Today: Weak Low Sweep Risk, Fibonacci Rebound Zone, EMA Overhead Pressure, Clean Support and Resistance Map
JPYUSD (Japanese Yen / U.S. Dollar) on the 1H chart is still operating in a bearish environment: repeated bearish BOS prints, price trading below a downward EMA stack, and a fresh impulsive drop into a clearly marked weak low area. This is the type of location where the market often pauses first (liquidity grab), then prints a corrective rebound into Fibonacci + EMA resistance before choosing the next continuation leg.
Today’s edge comes from separating two phases:
A likely corrective bounce from the weak low
The higher-probability sell opportunity at the Fibonacci retracement and EMA confluence

1H Market Structure: Bearish Control, Now Testing a Weak Low
The sequence into the right side of the chart shows consistent lower highs and lower lows with bearish BOS labels.
Price just expanded down aggressively into the weak low area around 0.006338, which is a typical liquidity target.
In this context, a bounce is common, but a bounce does not equal reversal unless structure flips (bullish CHoCH + acceptance above key resistance).
Bias:
Bearish overall, with a short-term corrective rebound risk from current lows.
EMA Context: Dynamic Resistance Above Price
The EMA cluster is stacked above price and sloping down, which usually means:
Rallies into the EMA band tend to be sold.
Trend change requires a strong 1H close back above the EMA cluster, followed by a hold on retest.
This aligns perfectly with a “sell-the-rally” framework.
Fibonacci: The Rebound Levels Match Your Chart Levels Cleanly
Using the most recent downswing (from the last swing high before the drop to the current weak low), the main retracement band sits right on your visible level ladder:
Key Fibonacci retracement zone (from the current low region):
38.2%: ~0.006360
50%: ~0.006366
61.8%: ~0.006373
These levels align tightly with your marked prices:
0.006357 (near the first bounce trigger)
0.006368 (mid retracement pivot)
0.006375 (deeper retracement / EMA confluence)
0.006381 (upper resistance pocket)
This cluster is the primary decision area for today.
Key Support and Resistance Levels (From the Screenshot)
Support
0.006338: weak low / current base (first liquidity pool)
0.006329–0.006330: next support pocket if the weak low fails (based on the visible scale extension)
Resistance
0.006357: first rebound checkpoint
0.006368: mid-level pivot (often acts like a magnet during pullbacks)
0.006375–0.006381: EMA + Fibonacci confluence (premium sell zone)
0.006400: higher resistance / strong high reference above (major ceiling if reversal builds)
RSI Guide (How to Use It Today)
Even without the RSI panel displayed, the price action suggests momentum likely pushed into oversold during the sharp drop. Use RSI as a filter:
Long bounce is cleaner if RSI reclaims 30 and pushes toward 50 during the rebound.
Shorts are higher quality if RSI fails below 50 while price taps the Fibonacci/EMA zone (0.006368–0.006381).
In bearish structure, RSI failing at 50 is often the “green light” for continuation shorts.
Trading Plans for Today (Practical, Level-Based)
Plan A: Tactical Bounce From the Weak Low (Short-Term Only)
This is a corrective move, not a trend reversal.
Entry idea:
Buy only after confirmation (1H/15m rejection wick + bullish close) holding above 0.006338.
Targets:
TP1: 0.006357
TP2: 0.006368
TP3: 0.006375 (only if rebound is strong)
Invalidation:
A clean 1H close below 0.006338 (signals weak low failure and continuation risk)
Best use:
Quick execution, partial profits early, do not overstay.
Plan B: Sell the Retracement Rally (Higher-Probability Setup)
This is the main plan aligned with the trend.
Sell zones:
0.006368–0.006373 (mid retracement)
0.006375–0.006381 (premium zone: EMA + 61.8% + level confluence)
Confirmation triggers:
Bearish rejection candle from the zone on 15m/1H
Lower-high formation under 0.006381
RSI fails to reclaim 50 during the pullback
Targets:
TP1: 0.006357
TP2: 0.006338 (retest weak low)
Extension: 0.006330 area if breakdown confirms
Invalidation:
1H acceptance above 0.006381 and hold on retest
Plan C: Reversal Scenario (Only With Structure Flip)
If you want a true reversal trade, require proof:
Bullish CHoCH + 1H close above 0.006381
Retest holds 0.006375–0.006381 as support
Targets:
0.006390 then 0.006400
Failure sign:
Break above 0.006381 that immediately gets rejected back below (bull trap behavior)
Summary
Structure is bearish, but the market is sitting at a weak low where a corrective bounce is likely.
The best “decision zone” for today is 0.006368–0.006381 (Fibonacci + EMA resistance).
Treat rallies into that zone as sell opportunities unless price proves a real reversal with acceptance above resistance.
JPYUSD (Japanese Yen / U.S. Dollar) on the 1H chart is still operating in a bearish environment: repeated bearish BOS prints, price trading below a downward EMA stack, and a fresh impulsive drop into a clearly marked weak low area. This is the type of location where the market often pauses first (liquidity grab), then prints a corrective rebound into Fibonacci + EMA resistance before choosing the next continuation leg.
Today’s edge comes from separating two phases:
A likely corrective bounce from the weak low
The higher-probability sell opportunity at the Fibonacci retracement and EMA confluence
1H Market Structure: Bearish Control, Now Testing a Weak Low
The sequence into the right side of the chart shows consistent lower highs and lower lows with bearish BOS labels.
Price just expanded down aggressively into the weak low area around 0.006338, which is a typical liquidity target.
In this context, a bounce is common, but a bounce does not equal reversal unless structure flips (bullish CHoCH + acceptance above key resistance).
Bias:
Bearish overall, with a short-term corrective rebound risk from current lows.
EMA Context: Dynamic Resistance Above Price
The EMA cluster is stacked above price and sloping down, which usually means:
Rallies into the EMA band tend to be sold.
Trend change requires a strong 1H close back above the EMA cluster, followed by a hold on retest.
This aligns perfectly with a “sell-the-rally” framework.
Fibonacci: The Rebound Levels Match Your Chart Levels Cleanly
Using the most recent downswing (from the last swing high before the drop to the current weak low), the main retracement band sits right on your visible level ladder:
Key Fibonacci retracement zone (from the current low region):
38.2%: ~0.006360
50%: ~0.006366
61.8%: ~0.006373
These levels align tightly with your marked prices:
0.006357 (near the first bounce trigger)
0.006368 (mid retracement pivot)
0.006375 (deeper retracement / EMA confluence)
0.006381 (upper resistance pocket)
This cluster is the primary decision area for today.
Key Support and Resistance Levels (From the Screenshot)
Support
0.006338: weak low / current base (first liquidity pool)
0.006329–0.006330: next support pocket if the weak low fails (based on the visible scale extension)
Resistance
0.006357: first rebound checkpoint
0.006368: mid-level pivot (often acts like a magnet during pullbacks)
0.006375–0.006381: EMA + Fibonacci confluence (premium sell zone)
0.006400: higher resistance / strong high reference above (major ceiling if reversal builds)
RSI Guide (How to Use It Today)
Even without the RSI panel displayed, the price action suggests momentum likely pushed into oversold during the sharp drop. Use RSI as a filter:
Long bounce is cleaner if RSI reclaims 30 and pushes toward 50 during the rebound.
Shorts are higher quality if RSI fails below 50 while price taps the Fibonacci/EMA zone (0.006368–0.006381).
In bearish structure, RSI failing at 50 is often the “green light” for continuation shorts.
Trading Plans for Today (Practical, Level-Based)
Plan A: Tactical Bounce From the Weak Low (Short-Term Only)
This is a corrective move, not a trend reversal.
Entry idea:
Buy only after confirmation (1H/15m rejection wick + bullish close) holding above 0.006338.
Targets:
TP1: 0.006357
TP2: 0.006368
TP3: 0.006375 (only if rebound is strong)
Invalidation:
A clean 1H close below 0.006338 (signals weak low failure and continuation risk)
Best use:
Quick execution, partial profits early, do not overstay.
Plan B: Sell the Retracement Rally (Higher-Probability Setup)
This is the main plan aligned with the trend.
Sell zones:
0.006368–0.006373 (mid retracement)
0.006375–0.006381 (premium zone: EMA + 61.8% + level confluence)
Confirmation triggers:
Bearish rejection candle from the zone on 15m/1H
Lower-high formation under 0.006381
RSI fails to reclaim 50 during the pullback
Targets:
TP1: 0.006357
TP2: 0.006338 (retest weak low)
Extension: 0.006330 area if breakdown confirms
Invalidation:
1H acceptance above 0.006381 and hold on retest
Plan C: Reversal Scenario (Only With Structure Flip)
If you want a true reversal trade, require proof:
Bullish CHoCH + 1H close above 0.006381
Retest holds 0.006375–0.006381 as support
Targets:
0.006390 then 0.006400
Failure sign:
Break above 0.006381 that immediately gets rejected back below (bull trap behavior)
Summary
Structure is bearish, but the market is sitting at a weak low where a corrective bounce is likely.
The best “decision zone” for today is 0.006368–0.006381 (Fibonacci + EMA resistance).
Treat rallies into that zone as sell opportunities unless price proves a real reversal with acceptance above resistance.

🪙 JOIN OUR FREE TELEGRAM GROUP 🪙
t.me/dnaprofits
Join the community group to get support and share knowledge!
️🥇 Exchange and learn market knowledge
️🥇 Support free trading signals
t.me/dnaprofits
Join the community group to get support and share knowledge!
️🥇 Exchange and learn market knowledge
️🥇 Support free trading signals
免責事項
これらの情報および投稿は、TradingViewが提供または承認する金融、投資、取引、またはその他の種類の助言もしくは推奨であることを意図したものではなく、またこれらに該当するものでもありません。詳細は利用規約をご覧ください。
🪙 JOIN OUR FREE TELEGRAM GROUP 🪙
t.me/dnaprofits
Join the community group to get support and share knowledge!
️🥇 Exchange and learn market knowledge
️🥇 Support free trading signals
t.me/dnaprofits
Join the community group to get support and share knowledge!
️🥇 Exchange and learn market knowledge
️🥇 Support free trading signals
免責事項
これらの情報および投稿は、TradingViewが提供または承認する金融、投資、取引、またはその他の種類の助言もしくは推奨であることを意図したものではなく、またこれらに該当するものでもありません。詳細は利用規約をご覧ください。