
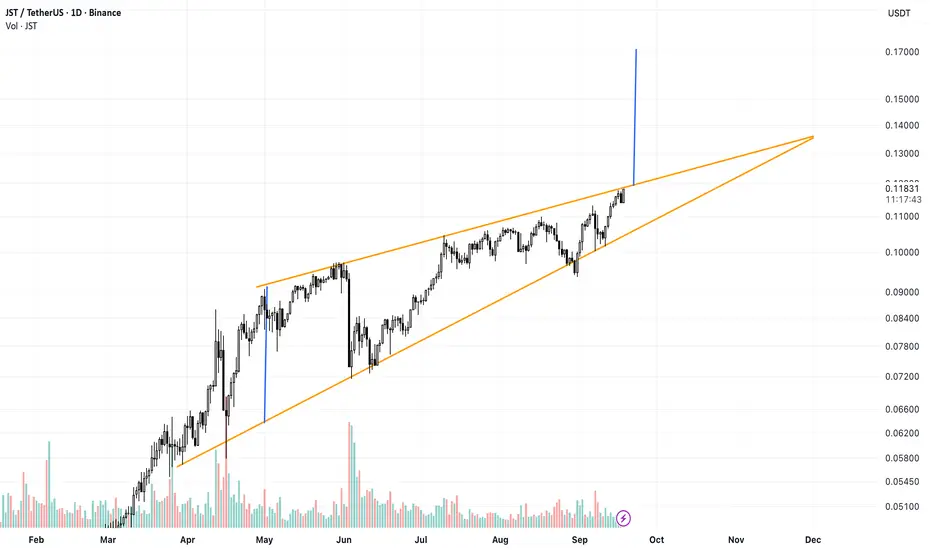
JST/USDT is trading inside a large rising wedge on the 1D chart, with price forming higher highs and higher lows while both trendlines gradually converge. Price is now testing the upper boundary around $0.118–$0.120 after another strong push from the lower support.
A confirmed daily breakout and hold above the upper trendline could trigger a bullish expansion toward the $0.165–$0.170 target area. However, because a rising wedge is traditionally a bearish structure, a rejection from the upper boundary followed by a breakdown below the rising support would weaken the bullish scenario and increase the probability of a deeper correction.
A confirmed daily breakout and hold above the upper trendline could trigger a bullish expansion toward the $0.165–$0.170 target area. However, because a rising wedge is traditionally a bearish structure, a rejection from the upper boundary followed by a breakdown below the rising support would weaken the bullish scenario and increase the probability of a deeper correction.

免責事項
これらの情報および投稿は、TradingViewが提供または承認する金融、投資、取引、またはその他の種類の助言もしくは推奨であることを意図したものではなく、またこれらに該当するものでもありません。詳細は利用規約をご覧ください。
免責事項
これらの情報および投稿は、TradingViewが提供または承認する金融、投資、取引、またはその他の種類の助言もしくは推奨であることを意図したものではなく、またこれらに該当するものでもありません。詳細は利用規約をご覧ください。