
JUSTDIAL [for swing trading ]
Price Pattern:
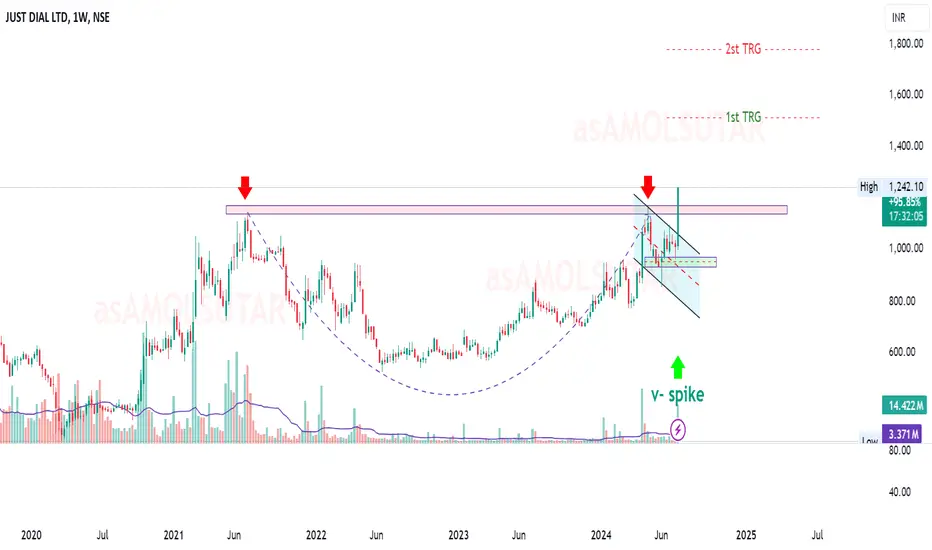
There is a cup and handle pattern forming, with the cup's bottom forming around the 2022-2023 period and the handle forming recently.
The breakout from the handle is a positive sign and could lead to a strong upward move if it holds above the resistance.
Trend Channel:
The descending channel (handle part of the cup and handle) is shown, and the recent breakout from this channel is a bullish signal.
Targets (TRG):
The chart shows two target levels: the first target (1st TRG) around 1400 and the second target (2st TRG) around 1800. These levels can be considered as potential profit-taking points.
Volume Spike:
The green arrow indicating a volume spike suggests increased buying interest. This can be a sign of accumulation, which is bullish.
Entry Point:
A good entry point would be on a pullback to the breakout level, around 1200-1250, which is now a support zone.
Stop Loss:
Place a stop loss below the support zone, around 1150-1180, to limit potential losses if the breakout fails.
First Target (1st TRG):
Aim for the first target around 1400, as indicated on the chart. This level is likely to encounter some resistance.
Second Target (2st TRG):
If the price momentum continues, the second target around 1800 can be considered for additional profits.
Volume Confirmation:
News :-
in.tradingview.com/news/reuters.com,2024:newsml_L4N3JA0K1:0-india-s-just-dial-jumps-to-9-year-high-after-upbeat-q1-results/
for MORE check in my Tv-id " in.tradingview.com/u/asAMOLSUTAR/ "
If You LIKE👌👌 MY Idea ......Boost.🔥🔥🔥.. its.

"Disclosure : I am not Sebi-registered." This channel is for only educational purpose. Any profit/loss, I am not responsible.
Before taking any trade on our charts / calls, please consult your financial advisors. Thanks
This stock Multi-year breakout with high volume spike today getting last movement upper circuit so .. buyer are very aggressive looking .
Price Pattern:
There is a cup and handle pattern forming, with the cup's bottom forming around the 2022-2023 period and the handle forming recently.
The breakout from the handle is a positive sign and could lead to a strong upward move if it holds above the resistance.
Trend Channel:
The descending channel (handle part of the cup and handle) is shown, and the recent breakout from this channel is a bullish signal.
Targets (TRG):
The chart shows two target levels: the first target (1st TRG) around 1400 and the second target (2st TRG) around 1800. These levels can be considered as potential profit-taking points.
Volume Spike:
The green arrow indicating a volume spike suggests increased buying interest. This can be a sign of accumulation, which is bullish.
Swing Trading Points
Entry Point:
A good entry point would be on a pullback to the breakout level, around 1200-1250, which is now a support zone.
Stop Loss:
Place a stop loss below the support zone, around 1150-1180, to limit potential losses if the breakout fails.
First Target (1st TRG):
Aim for the first target around 1400, as indicated on the chart. This level is likely to encounter some resistance.
Second Target (2st TRG):
If the price momentum continues, the second target around 1800 can be considered for additional profits.
Volume Confirmation:
Keep an eye on the volume. A continued increase in volume on upward moves will confirm the strength of the trend.
News :-
in.tradingview.com/news/reuters.com,2024:newsml_L4N3JA0K1:0-india-s-just-dial-jumps-to-9-year-high-after-upbeat-q1-results/
for MORE check in my Tv-id " in.tradingview.com/u/asAMOLSUTAR/ "
If You LIKE👌👌 MY Idea ......Boost.🔥🔥🔥.. its.
"Disclosure : I am not Sebi-registered." This channel is for only educational purpose. Any profit/loss, I am not responsible.
Before taking any trade on our charts / calls, please consult your financial advisors. Thanks

免責事項
これらの情報および投稿は、TradingViewが提供または承認する金融、投資、取引、またはその他の種類の助言もしくは推奨であることを意図したものではなく、またこれらに該当するものでもありません。詳細は利用規約をご覧ください。
免責事項
これらの情報および投稿は、TradingViewが提供または承認する金融、投資、取引、またはその他の種類の助言もしくは推奨であることを意図したものではなく、またこれらに該当するものでもありません。詳細は利用規約をご覧ください。