ロング
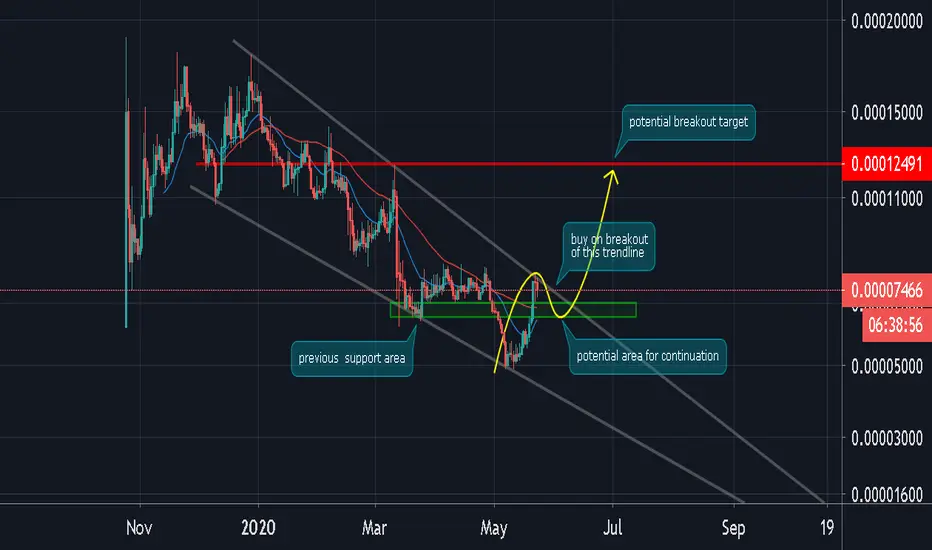
KAVA/BTC (Bullish Descending Pattern?)
KAVA/BTC
-testing the downward trendline resistance
-if this will be a temporary top
-the potential pullback area is between 7000-6500
-the best trading strategy is
-wait for good pullback and break of the trendline
-on the closed above the descending line resistance
-that's your buy signal
-it will signal a high chance of trend reversal
-upside target is up to 12500s

免責事項
これらの情報および投稿は、TradingViewが提供または承認する金融、投資、取引、またはその他の種類の助言もしくは推奨であることを意図したものではなく、またこれらに該当するものでもありません。詳細は利用規約をご覧ください。
免責事項
これらの情報および投稿は、TradingViewが提供または承認する金融、投資、取引、またはその他の種類の助言もしくは推奨であることを意図したものではなく、またこれらに該当するものでもありません。詳細は利用規約をご覧ください。