
Hello traders
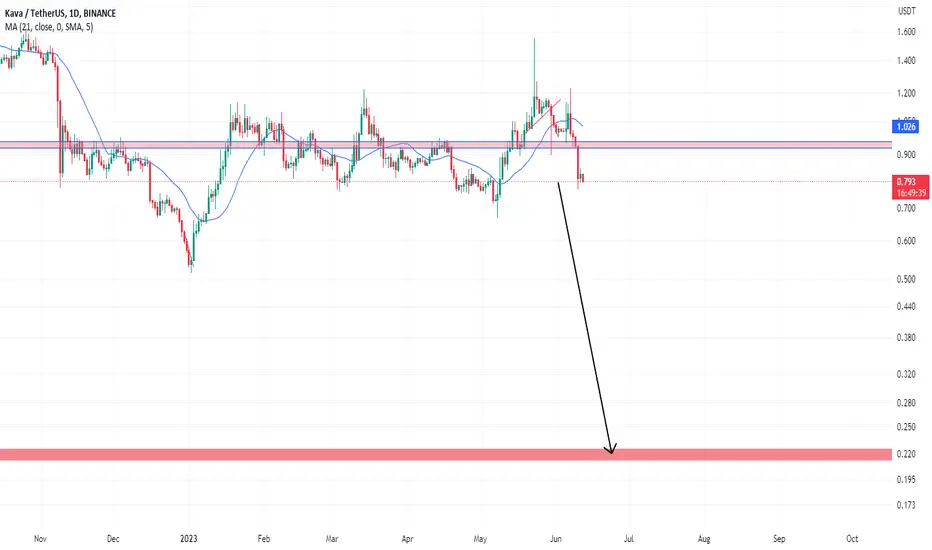
I've updated KAVA chart.
The old chart was in 4H timeframe and this one is daily.
I attach previous chart in bottom of this chart.
After drawing chart I remove INDICATORES I don't analyze without indicators.
I've updated KAVA chart.
The old chart was in 4H timeframe and this one is daily.
I attach previous chart in bottom of this chart.
After drawing chart I remove INDICATORES I don't analyze without indicators.
トレード稼働中
トレード稼働中
トレード稼働中
トレード稼働中
トレード稼働中
トレード終了: ストップロスに到達

関連の投稿
免責事項
これらの情報および投稿は、TradingViewが提供または承認する金融、投資、取引、またはその他の種類の助言もしくは推奨であることを意図したものではなく、またこれらに該当するものでもありません。詳細は利用規約をご覧ください。
関連の投稿
免責事項
これらの情報および投稿は、TradingViewが提供または承認する金融、投資、取引、またはその他の種類の助言もしくは推奨であることを意図したものではなく、またこれらに該当するものでもありません。詳細は利用規約をご覧ください。