更新済
Roadmap for KEY chart
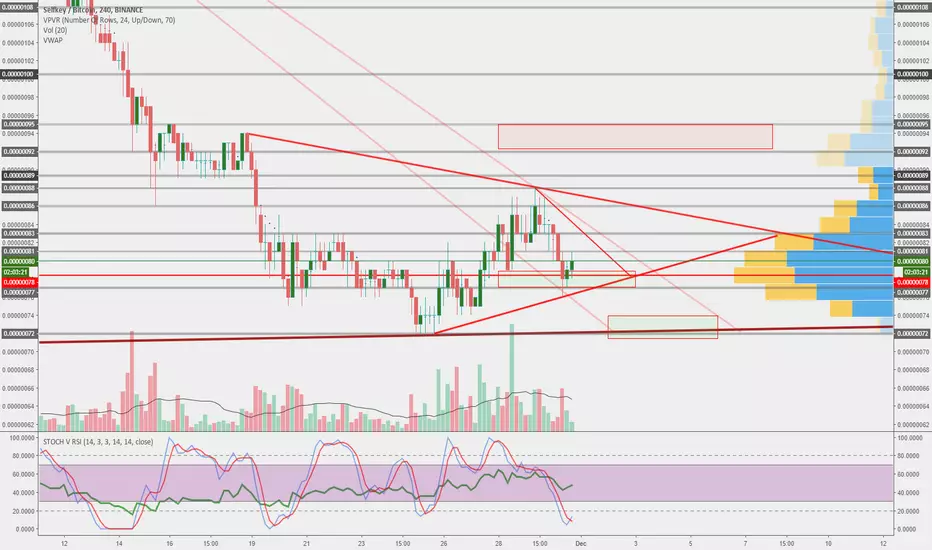
Just a review, no actual bullish signs I see at the moment. But if/once BTC continue growing, KEY will follow as it follows each bitcoin move lately.
Day chart

Buy zone according to day chart is 77-79 or 72-74. So far the first one worked out as support, but if BTC falls, you know where to pick it up. Targets: 90-97-115. A little "concervative" targets. But beter be on a safe side. Heaviest resistance will be in 95-97 zone.
One hour chart for further updates.

Day chart
Buy zone according to day chart is 77-79 or 72-74. So far the first one worked out as support, but if BTC falls, you know where to pick it up. Targets: 90-97-115. A little "concervative" targets. But beter be on a safe side. Heaviest resistance will be in 95-97 zone.
One hour chart for further updates.
ノート
KEY went through 81 resistance nicely and stopped at 83. Depending on BTC performace it will eather roll back or continue growingノート
Not very interesting. Lay on final support line. If falls below it will sink.
ノート
Finally accumulation is ending and KEY is starting to grow. 
FREE telegram channels:
Main crypto channel - t.me/WiseAnalyze
Crypto chat - t.me/WiseAnalyzeChat
Crypto watchlist - t.me/wiseanalize
Main crypto channel - t.me/WiseAnalyze
Crypto chat - t.me/WiseAnalyzeChat
Crypto watchlist - t.me/wiseanalize
免責事項
これらの情報および投稿は、TradingViewが提供または承認する金融、投資、取引、またはその他の種類の助言もしくは推奨であることを意図したものではなく、またこれらに該当するものでもありません。詳細は利用規約をご覧ください。
FREE telegram channels:
Main crypto channel - t.me/WiseAnalyze
Crypto chat - t.me/WiseAnalyzeChat
Crypto watchlist - t.me/wiseanalize
Main crypto channel - t.me/WiseAnalyze
Crypto chat - t.me/WiseAnalyzeChat
Crypto watchlist - t.me/wiseanalize
免責事項
これらの情報および投稿は、TradingViewが提供または承認する金融、投資、取引、またはその他の種類の助言もしくは推奨であることを意図したものではなく、またこれらに該当するものでもありません。詳細は利用規約をご覧ください。