
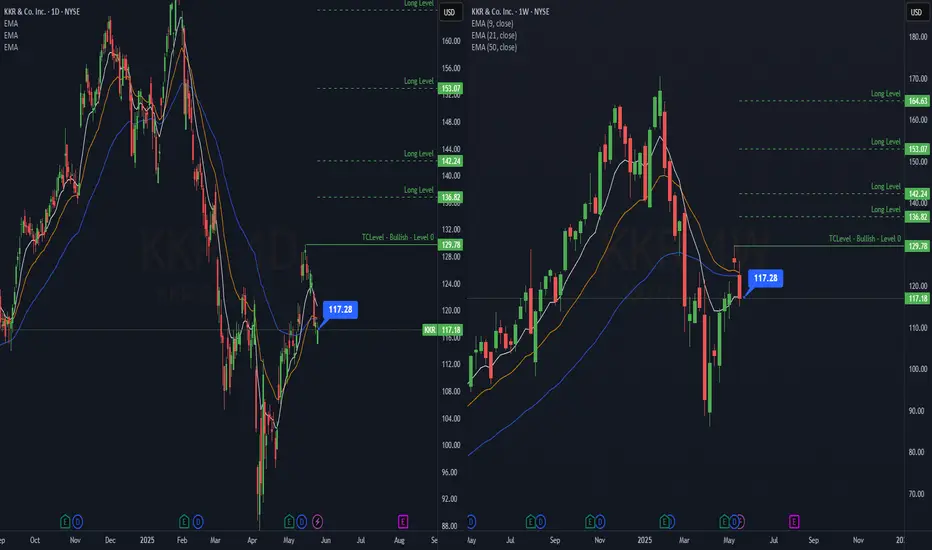
Daily -> Pullback after bullish crossovers of every EMA
Weekly -> EMA 21 at the test of EMA 50
Watching for a #TopSwing Setup on the Daily Chart
Area of $130 as key resistance.
Support → $110-$103
Weekly -> EMA 21 at the test of EMA 50
Watching for a #TopSwing Setup on the Daily Chart
Area of $130 as key resistance.
Support → $110-$103

If you want to know more and receive updates, follow me tizycharts.substack.com/
免責事項
これらの情報および投稿は、TradingViewが提供または承認する金融、投資、取引、またはその他の種類の助言もしくは推奨であることを意図したものではなく、またこれらに該当するものでもありません。詳細は利用規約をご覧ください。
If you want to know more and receive updates, follow me tizycharts.substack.com/
免責事項
これらの情報および投稿は、TradingViewが提供または承認する金融、投資、取引、またはその他の種類の助言もしくは推奨であることを意図したものではなく、またこれらに該当するものでもありません。詳細は利用規約をご覧ください。