ロング
KORS Breaking Out
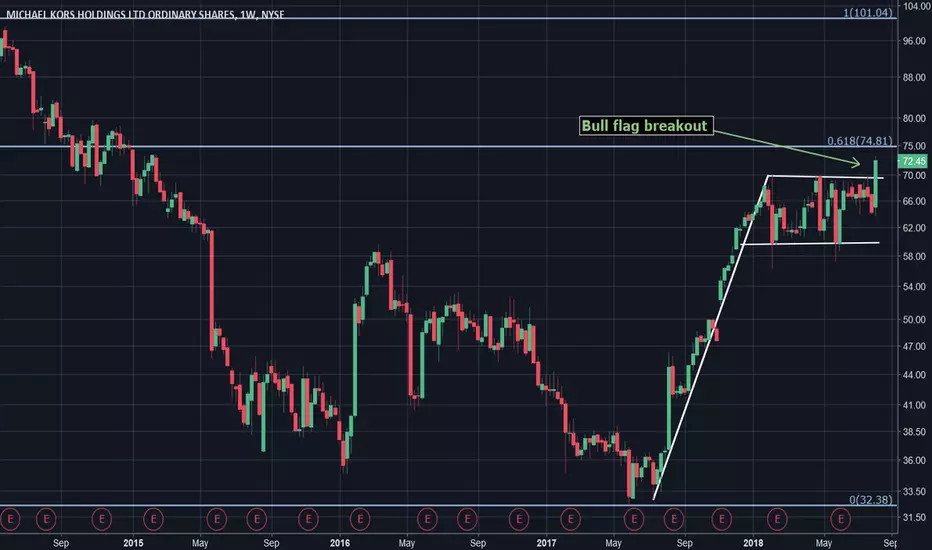
Shares of KORS appear to be breaking out to the upside from a bull flag formation on the weekly chart. Previous resistance at $70 should act as support to confirm.
Longer-term resistance overhead at $75, the 61.8% retracement from the all-time highs north of $100 to the subsequent lows at $33.
The target from the flag is around $82-85, which would coincide nicely with the 78.6% retracement at $86 of the aforementioned high to low.
Look for the breakout to be confirmed with a weekly close above $70 and a successful retest of that level before shares ramp higher.
Longer-term resistance overhead at $75, the 61.8% retracement from the all-time highs north of $100 to the subsequent lows at $33.
The target from the flag is around $82-85, which would coincide nicely with the 78.6% retracement at $86 of the aforementioned high to low.
Look for the breakout to be confirmed with a weekly close above $70 and a successful retest of that level before shares ramp higher.

免責事項
これらの情報および投稿は、TradingViewが提供または承認する金融、投資、取引、またはその他の種類の助言もしくは推奨であることを意図したものではなく、またこれらに該当するものでもありません。詳細は利用規約をご覧ください。
免責事項
これらの情報および投稿は、TradingViewが提供または承認する金融、投資、取引、またはその他の種類の助言もしくは推奨であることを意図したものではなく、またこれらに該当するものでもありません。詳細は利用規約をご覧ください。