
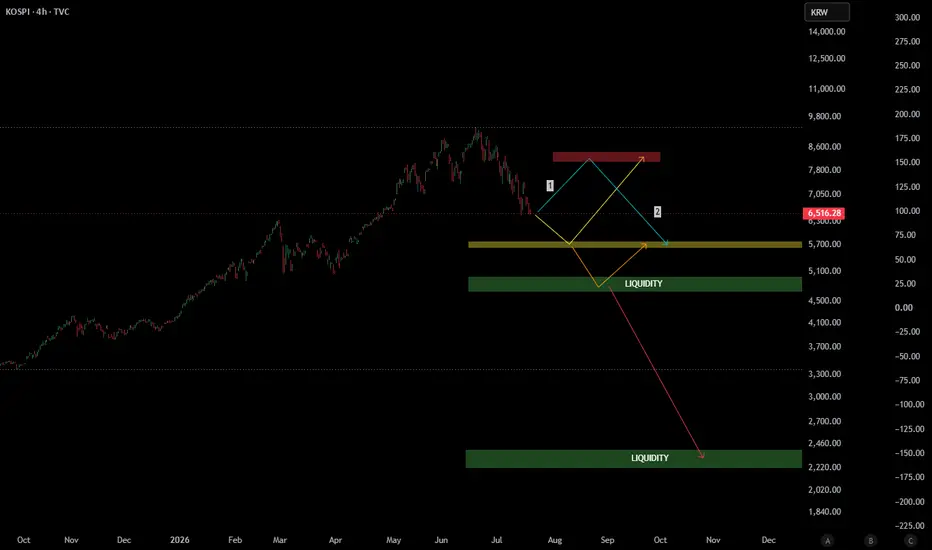
The rally left a textbook trail: higher highs, breaks of structure, momentum riding comfortably above the long-term average. Then came the change of character, followed by a break of structure to the downside, and now price trades near the 7,000 KRW area, below the level that used to hold it up. The weak high near 9,800 KRW is exactly that: weak, and unclaimed.
The map from here:
Scenario 1: price dips first into the zone of interest around 5,700 KRW, gathers demand, and rotates up into the supply area near 8,500 KRW. The weak high territory would be the natural magnet, but supply gets the first word.
Scenario 2: the mirror image. Price rallies into the 8,500 KRW supply first, gets rejected, and rotates back down to the 5,700 KRW zone. Same destinations, opposite order.
The sweep: below the zone of interest sits the strong low, wrapped in liquidity around the 4,800 to 5,000 KRW region. A dip into that pool followed by a sharp reclaim would be the classic institutional move, take the stops, then reverse.
The breakdown: if the strong low fails, the structural story changes completely. A much deeper liquidity pool waits near 2,300 KRW, and the path to it is long, fast, and unfriendly. Low probability until proven otherwise, but it stays on the map because ignoring tail scenarios is how accounts disappear.
Change of character is a warning, not a verdict. We let the zones vote first.
Hidden in plain sight. EQC.
Follow, Boost, Join, Thank You!
Financial Disclaimer: This post is not financial advice. I am not your financial advisor, your life coach, or your legally responsible adult. Always do your own research and never trade based solely on internet comedy.
The map from here:
Scenario 1: price dips first into the zone of interest around 5,700 KRW, gathers demand, and rotates up into the supply area near 8,500 KRW. The weak high territory would be the natural magnet, but supply gets the first word.
Scenario 2: the mirror image. Price rallies into the 8,500 KRW supply first, gets rejected, and rotates back down to the 5,700 KRW zone. Same destinations, opposite order.
The sweep: below the zone of interest sits the strong low, wrapped in liquidity around the 4,800 to 5,000 KRW region. A dip into that pool followed by a sharp reclaim would be the classic institutional move, take the stops, then reverse.
The breakdown: if the strong low fails, the structural story changes completely. A much deeper liquidity pool waits near 2,300 KRW, and the path to it is long, fast, and unfriendly. Low probability until proven otherwise, but it stays on the map because ignoring tail scenarios is how accounts disappear.
Change of character is a warning, not a verdict. We let the zones vote first.
Hidden in plain sight. EQC.
Follow, Boost, Join, Thank You!
Financial Disclaimer: This post is not financial advice. I am not your financial advisor, your life coach, or your legally responsible adult. Always do your own research and never trade based solely on internet comedy.
トレード稼働中
Looks like Scenario 1 (yellow) is in play, but, there might be a plot twist around the current level. Be safe!Hidden in plain sight. EQC.
Follow, Boost, Join, Thank You!
Financial Disclaimer: This post is not financial advice. I am not your financial advisor, your life coach, or your legally responsible adult. Always do your own research and never trade based solely on internet comedy.
ノート
Looks like it´s going for the liquidity around 4800, but it can bounce now from where it stands and then move upwards where a new liquidity zone formed around 7185. There, if it rejects , we´ll have for the long term a huge crisis and a retest into the 12M cycle.
ノート
Liquidity grab, and now?

免責事項
これらの情報および投稿は、TradingViewが提供または承認する金融、投資、取引、またはその他の種類の助言もしくは推奨であることを意図したものではなく、またこれらに該当するものでもありません。詳細は利用規約をご覧ください。
免責事項
これらの情報および投稿は、TradingViewが提供または承認する金融、投資、取引、またはその他の種類の助言もしくは推奨であることを意図したものではなく、またこれらに該当するものでもありません。詳細は利用規約をご覧ください。