
KPIT Tech
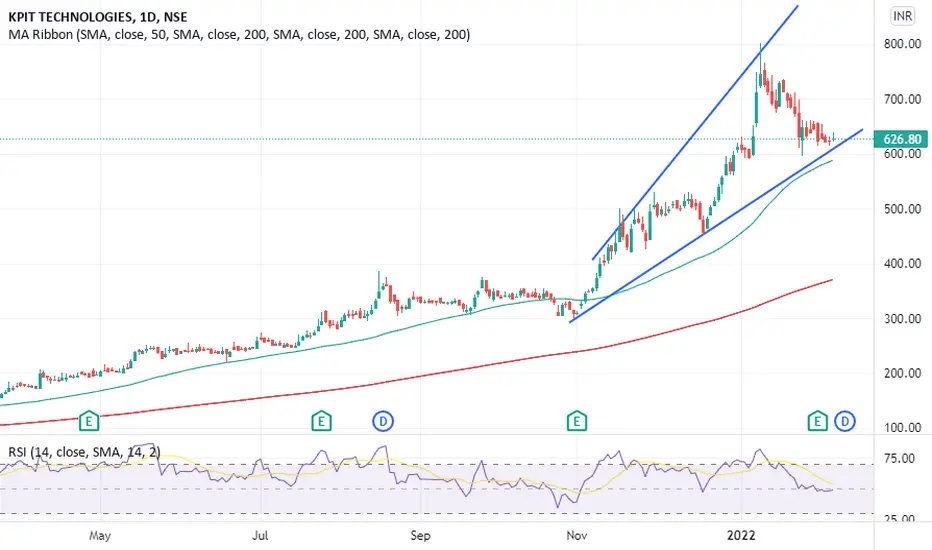
Above its 50 Day Moving Average
RSI - @ 49 Daily charts
1. I have drawn the Trend lines on where it would take support and bounce back.
Safe traders when to enter? When RSI reaches 60 currently at 49 on daily Charts
Risk Takers - Right time to buy now and on dips i do see a reversal and soon can see an good uptrend by this friday or next week start
Like & Follow
Happy Trading
Above its 50 Day Moving Average
RSI - @ 49 Daily charts
1. I have drawn the Trend lines on where it would take support and bounce back.
Safe traders when to enter? When RSI reaches 60 currently at 49 on daily Charts
Risk Takers - Right time to buy now and on dips i do see a reversal and soon can see an good uptrend by this friday or next week start
Like & Follow
Happy Trading

免責事項
これらの情報および投稿は、TradingViewが提供または承認する金融、投資、取引、またはその他の種類の助言もしくは推奨であることを意図したものではなく、またこれらに該当するものでもありません。詳細は利用規約をご覧ください。
免責事項
これらの情報および投稿は、TradingViewが提供または承認する金融、投資、取引、またはその他の種類の助言もしくは推奨であることを意図したものではなく、またこれらに該当するものでもありません。詳細は利用規約をご覧ください。