
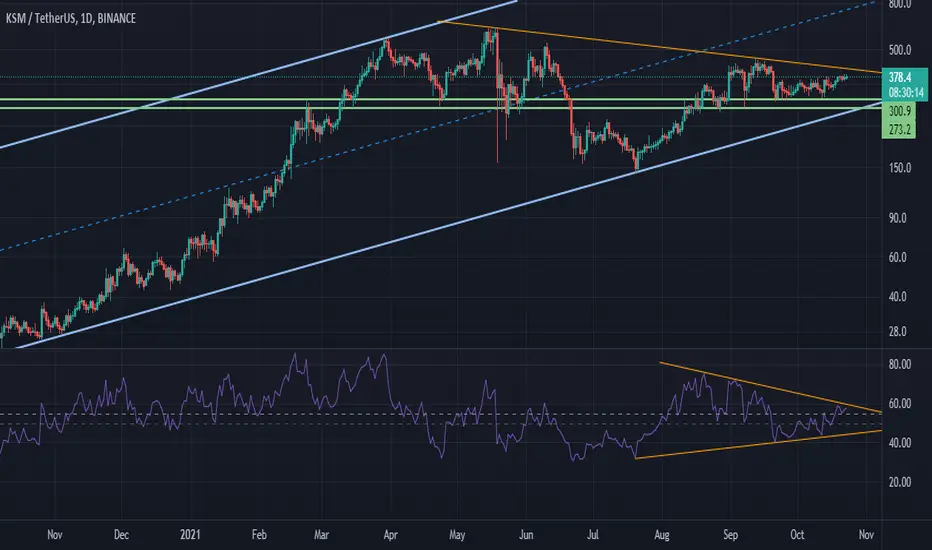
It has a chart similar to the Bitcoin chart when it was priced at $ 40,000
There is a lot of room for growth if you cross the trend line
Shopping in steps is the best way
For the next two months, any negative amount on this chart is just a good buy position
There is a lot of room for growth if you cross the trend line
Shopping in steps is the best way
For the next two months, any negative amount on this chart is just a good buy position

免責事項
これらの情報および投稿は、TradingViewが提供または承認する金融、投資、取引、またはその他の種類の助言もしくは推奨であることを意図したものではなく、またこれらに該当するものでもありません。詳細は利用規約をご覧ください。
免責事項
これらの情報および投稿は、TradingViewが提供または承認する金融、投資、取引、またはその他の種類の助言もしくは推奨であることを意図したものではなく、またこれらに該当するものでもありません。詳細は利用規約をご覧ください。