
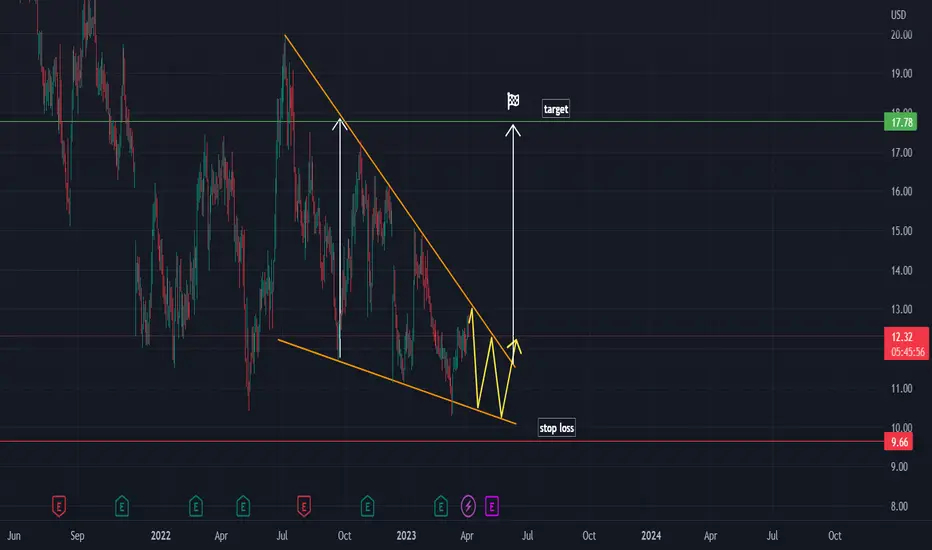
On this chart there is a falling wedge pattern.
The price is continuing to move inside the pattern.
We expect it to retest the trendline before bouncing up. Once it breaks out of the pattern it would be a good time to enter the long position.
Target and stop loss are shown on the chart.
The price is continuing to move inside the pattern.
We expect it to retest the trendline before bouncing up. Once it breaks out of the pattern it would be a good time to enter the long position.
Target and stop loss are shown on the chart.

💥 Free signals and ideas ➡ t.me/vfinvestment
免責事項
これらの情報および投稿は、TradingViewが提供または承認する金融、投資、取引、またはその他の種類の助言もしくは推奨であることを意図したものではなく、またこれらに該当するものでもありません。詳細は利用規約をご覧ください。
💥 Free signals and ideas ➡ t.me/vfinvestment
免責事項
これらの情報および投稿は、TradingViewが提供または承認する金融、投資、取引、またはその他の種類の助言もしくは推奨であることを意図したものではなく、またこれらに該当するものでもありません。詳細は利用規約をご覧ください。