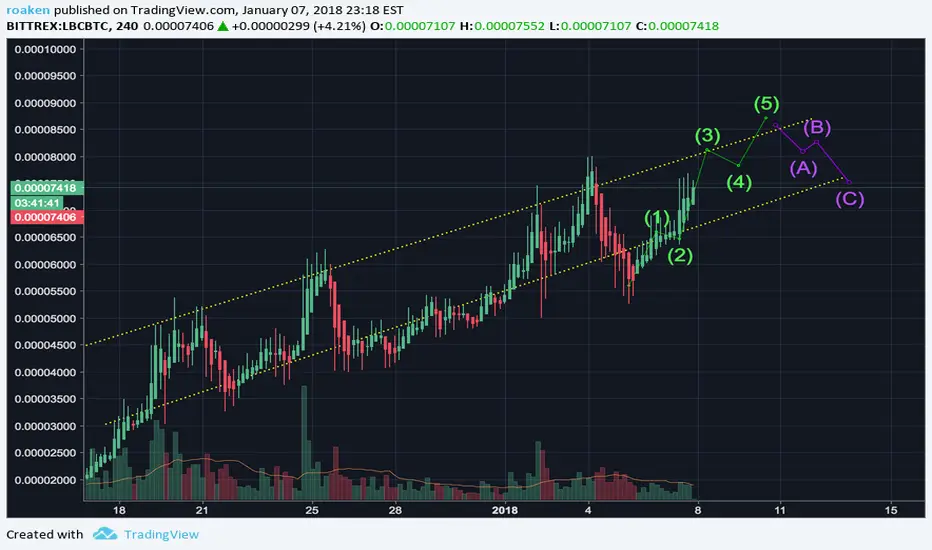
I've been day trading a couple coins like LBRY recently because they are so in line with linear high and low resistence. Running an Elliot Wave sequence on our current position you can see new highs on the horizon
ノート
I'm happy with this graph. It followed the structure but at different levels. I think it's important to not always focus on numbers but on where we're at in the structure. it did an elliot wave and abc correction then spiked back to resistance line.k Nice.
免責事項
これらの情報および投稿は、TradingViewが提供または承認する金融、投資、取引、またはその他の種類の助言もしくは推奨であることを意図したものではなく、またこれらに該当するものでもありません。詳細は利用規約をご覧ください。
免責事項
これらの情報および投稿は、TradingViewが提供または承認する金融、投資、取引、またはその他の種類の助言もしくは推奨であることを意図したものではなく、またこれらに該当するものでもありません。詳細は利用規約をご覧ください。