
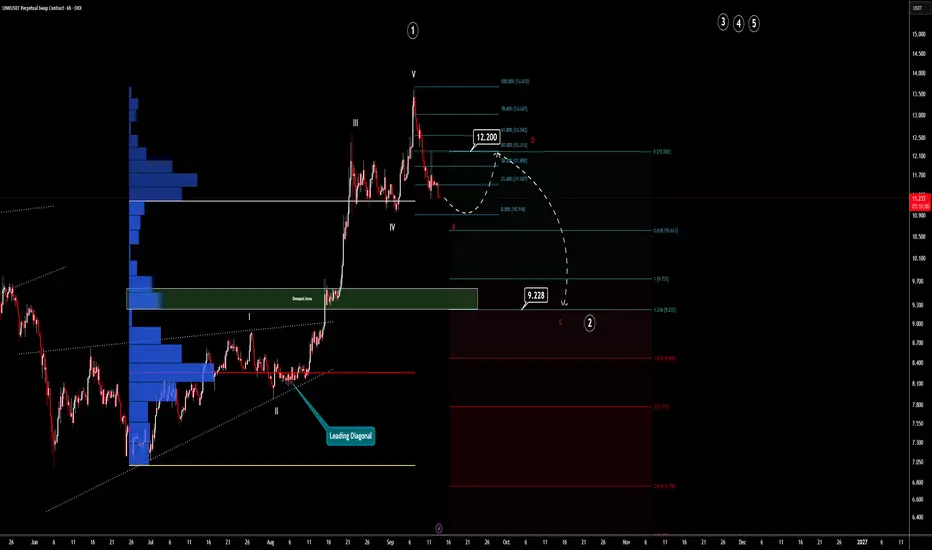
Chainlink shows a clear sign that an inner impulsive move is coming to an end.
This chart shows a clear textbook illustration of Elliott Wave analysis.
After forming the diagonal, an impulsive move has ended. Now is the time for an A-B-C correction, and that small correction is going to create a wave 2 move on the daily timeframe.
If we consider the Fed + BOJ rate decisions in the coming days, this chart makes even more sense.
No need for complicated explanations. First down, then up. Simple as that.
This chart shows a clear textbook illustration of Elliott Wave analysis.
After forming the diagonal, an impulsive move has ended. Now is the time for an A-B-C correction, and that small correction is going to create a wave 2 move on the daily timeframe.
If we consider the Fed + BOJ rate decisions in the coming days, this chart makes even more sense.
No need for complicated explanations. First down, then up. Simple as that.
トレード終了: 利益確定目標に到達
Link has reached its wave B target, do not try to short anything, market is bullish. Analysis might be invalidated easily.
免責事項
これらの情報および投稿は、TradingViewが提供または承認する金融、投資、取引、またはその他の種類の助言もしくは推奨であることを意図したものではなく、またこれらに該当するものでもありません。詳細は利用規約をご覧ください。
免責事項
これらの情報および投稿は、TradingViewが提供または承認する金融、投資、取引、またはその他の種類の助言もしくは推奨であることを意図したものではなく、またこれらに該当するものでもありません。詳細は利用規約をご覧ください。